FIGURE SUMMARY
Title

Antiangiogenesis effect of timosaponin AIII on HUVECs in vitro and zebrafish embryos in vivo

Authors
Zhou, Z.Y., Zhao, W.R., Xiao, Y., Zhou, X.M., Huang, C., Shi, W.T., Zhang, J., Ye, Q., Chen, X.L., Tang, J.Y.
Source
Full text @ Acta Pharmacol. Sin.

Chemical structure of timosaponin AIII (Timo AIII, PubChem CID: 10628815)

Timo AIII inhibits ISVs growth in zebrafish. a Transgenic zebrafish Tg(fli-1a: EGFP)y1 expressed EGFP in endothelial cells, and the vessels were easily observed under a microscope. Twenty-four hpf (hour post fertilization) zebrafish embryos were treated with various concentrations of Timo AIII (0.5, 1, 2, and 3 µM) for 12 h and then imaged under an inverted microscope. Red asterisks indicate defective ISVs. b The statistical graph indicates the intact and defective vessel numbers of ISVs in zebrafish. The results are presented as the means ± S.E.M. *P < 0.05 and ***P < 0.001 versus the control group

Timo AIII inhibits SIVs growth in zebrafish. a Twenty-four hpf (hours post fertilization) zebrafish embryos were treated with various concentrations of Timo AIII (0.5, 1, and 2 µM) for 48 h; and then, the SIVs were imaged under an inverted microscope. Zebrafish incubated with 0.1% DMSO served as a vehicle control. b The total area of SIVs was analyzed by ImageJ, and the data are expressed as folds of the control. The results are presented as the means ± S.E.M. *P < 0.05 and ***P < 0.001 versus the control group

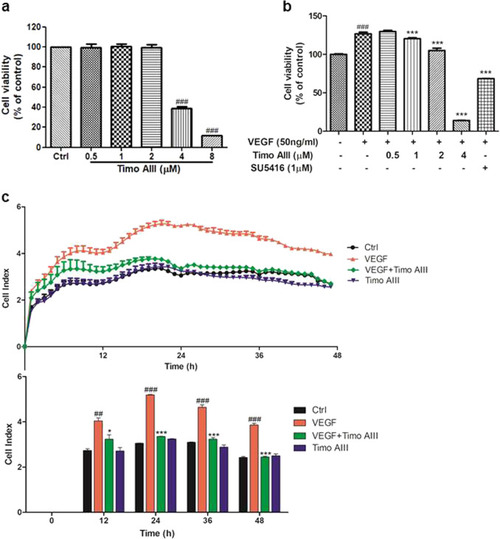
Timo AIII inhibits endothelial cell proliferation in HUVECs. a HUVECs were treated with various concentrations of Timo AIII (0.5, 1, 2, 4, and 8 µM) for 24 h, and cell viability was tested by the MTT assay. b HUVEC cells were cotreated with VEGF (50 ng/mL) and various concentrations of Timo AIII (0.5, 1, 2, and 4 µM) or SU5416 (1 µM), which served as a positive control, for 24 h, and cell viability was determined by the MTT assay. c Cell impedance, which was expressed as the cell index and measured by the xCELLigence Real-time cell analysis (RTCA) system, was used to evaluate the proliferation in HUVECs. HUVECs were treated with VEGF (50 ng/mL), Timo AIII (2 µM), or VEGF (50 ng/mL) + Timo AIII (2 µM) for 48 h, and cell impedance was detected at 1-h intervals. Data are presented as the percentage of the control group. The results are presented as the means ± S.E.M. ##P < 0.01 and ###P < 0.001 versus the control group. *P < 0.05, ***P < 0.001 versus the VEGF-treated group

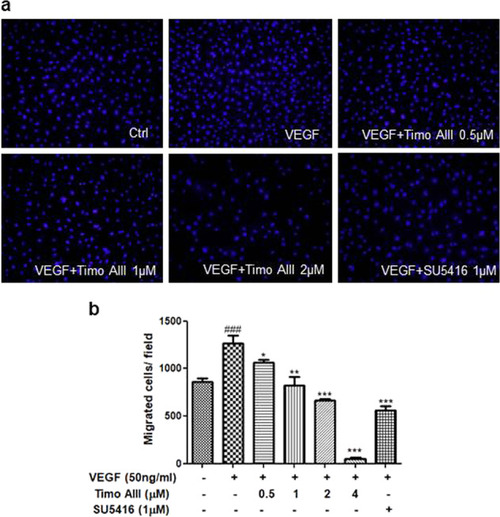
Timo AIII inhibits VEGF-induced migration in HUVECs. The migration ability of HUVECs was measured by a classical transwell migration assay. a HUVECs were treated with VEGF (50 ng/mL) and various concentrations (0.5, 1, 2, and 4 µM) of Timo AIII for 24 h. HUVECs incubated with 0.1% DMSO served as a vehicle control and with SU5416 (1 µM) as a positive control. The nuclei of HUVECs were stained with Hoechst 33342 and produced blue fluorescence when excited by the UV light. Representative images show the migration ability of HUVECs under the different treatment conditions. b The statistical graph shows the quantitative analysis of HUVEC migration. Data are presented as the cell number per field. The results are presented as the means ± S.E.M. ###P < 0.001 versus the control group; *P < 0.05, **P < 0.01, and ***P < 0.001 versus the VEGF-treated group

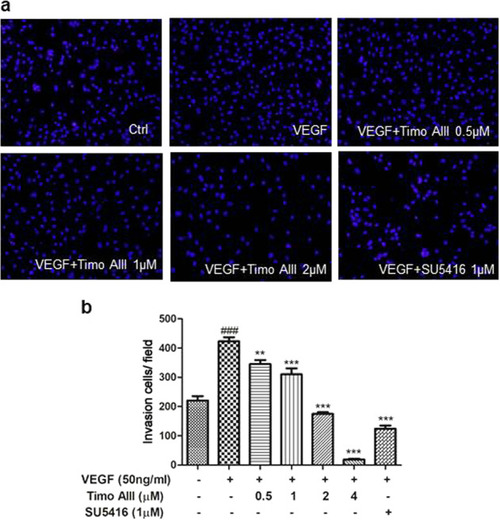
Timo AIII inhibits VEGF-induced invasion in HUVECs. The invasion ability of HUVECs was measured by a transwell system coated with Matrigel. a HUVECs were treated with VEGF (50 ng/mL) and various concentrations (0.5, 1, 2, and 4 µM) of Timo AIII for 24 h. HUVECs incubated with 0.1% DMSO served as a vehicle control and with SU5416 (1 µM) as a positive control. HUVECs were stained with Hoechst 33342. Representative images show the invasion ability of HUVECs under different treatment conditions. b The statistical graph shows the quantitative analysis of HUVEC invasion. Data are presented as the cell number per field. The results are presented as the means ± S.E.M. ###P < 0.001 versus the control group; **P < 0.01 and ***P < 0.001 versus the VEGF-treated group

Timo AIII inhibits endothelial cell tube formation in HUVECs. The tube formation ability of HUVECs was examined by a µ-Slide coated with Matrigel. a HUVECs were treated with VEGF (50 ng/mL) and various concentrations (0.5, 1, and 2 µM) of Timo AIII for 6 h. HUVECs incubated with 0.1% DMSO served as a vehicle control and with SU5416 (1 µM) as a positive control. HUVECs were imaged under an inverted microscope. Representative images show the tube formation ability of HUVECs under different treatment conditions. b The statistical graph shows the quantitative analysis of HUVEC tube formation. Data are presented as the loop number per field. c HUVECs were treated with VEGF (50 ng/mL) and various concentrations (0.5, 1, and 2 µM) of Timo AIII for 6 h. Cell viability was tested by the MTT assay. The results are presented as the means ± S.E.M. #P < 0.05 versus the control group; **P < 0.01 and ***P < 0.001 versus the VEGF-treated group

Timo AIII attenuates the VEGF/PI3K/Akt/MAPK signaling pathway in HUVECs. a–f HUVECs were treated with various concentrations of Timo AIII (0.5, 1, and 2 µM) for 24 h. HUVECs incubated with 0.1% DMSO served as a vehicle control. Phosphorylated and total proteins were detected by Western blotting using the specific antibodies. The ratio of phosphorylated and total proteins was calculated. Data are presented as the fold of the control group. The results are presented as the means ± S.E.M. *P < 0.05, **P < 0.01, and ***P < 0.001 versus the control group

Timo AIII suppresses the VEGF-activated VEGF/PI3K/Akt/MAPK signaling pathway in HUVECs. a–c HUVECs were treated with VEGF (50 ng/mL) with or without Timo AIII (2 µM) for 24 h. HUVECs incubated with 0.1% DMSO served as a vehicle control. Phosphorylated and total proteins were detected by Western blotting using the specific antibodies. The ratios of phosphorylated and total proteins were calculated. Data are presented as the fold of the control group. The results are presented as the means ± S.E.M. *P < 0.05 and **P < 0.01 versus the control group. #P < 0.05, ##P < 0.01, and ###P < 0.001 versus the VEGF-treated group

Acknowledgments
This image is the copyrighted work of the attributed author or publisher, and ZFIN has permission only to display this image to its users. Additional permissions should be obtained from the applicable author or publisher of the image. Full text @ Acta Pharmacol. Sin.