FIGURE SUMMARY
Title

IL-10 from plasmacytoid dendritic cells promotes angiogenesis in the early stage of endometriosis

Authors
Suen, J.L., Chang, Y., Shiu, Y.S., Hsu, C.Y., Sharma, P., Chiu, C.C., Chen, Y.J., Hour, T.C., Tsai, E.M.
Source
Full text @ J. Pathol.

The effect of IL‐10‐expressing pDCs on endometriosis development in a surgically induced model. (A) Lesion area and weight from C57BL/6 mice 4 weeks after surgery. The mice were locally treated at the implantation site as indicated. rmIL‐10, recombinant murine IL‐10; IC, isotype control; αmIL‐10, mAb against mouse IL‐10. n = 3 mice in the PBS/rmIL‐10‐treated group; n = 4 mice in the IC/αmIL‐10‐treated group. (B) IL‐10 levels from co‐culture supernatants with or without purified splenic pDCs from C57BL/6 mice (n = 6), apoptotic cells, and R848. Data from two independent experiments are shown. (C) Lesion area and weight from endometrial surgery mice that received PBS or purified splenic pDCs from syngeneic mice intravenously 1 day before surgery. n = 3 mice in the PBS group; n = 4 mice in the pDC group. (D) Lesion area and weight from surgery mice that received PBS or purified splenic pDCs from Il10−/− and littermate control (Il10+/+) mice intravenously. n = 3 mice in the PBS and Il10+/+‐pDC groups; n = 4 mice in the Il10−/−‐pDC group. The data in A, C, and D represent one of two independent experiments with consistent results. The horizontal line marks the mean for each group. N.D. = not detectable.

Quantification of CD31+ cells in endometriotic lesions in the murine model. (A) Representative immunofluorescence sections of lesions from PBS‐ or rmIL‐10‐treated mice. Blue, nucleus (DAPI); red, CD31 (Alexa Fluor 568). Red scale bars = 20 µm. (B) Representative dot plots analysed by TissueQuest software. (C) The frequency of CD31+ cells among DAPI+ cells in the whole field of each lesion. IC, isotype control; αmIL‐10, mAb against mouse IL‐10. One dot represents one section from each endometriotic lesion. One endometriotic lesion was sampled per mouse. n = 4 mice in the PBS/rmIL‐10‐treated group; n = 5 mice in the IC/αmIL‐10‐treated group. (D, E) Representative immunohistochemistry sections of lesions for Ki‐67 or active caspase‐3 (brown colour) from αmIL‐10‐treated mice. Blue, haematoxylin counterstain. Black scale bar (left panels) = 200 µm; green scale bar (right panels) = 20 µm. (F, G) The frequency of Ki‐67+ cells or active caspase‐3+ cells among haematoxylin+ cells in the whole field of each lesion. One dot represents one section from each endometriotic lesion. Two endometriotic lesions per treatment were from one mouse. n = 3 mice in the IC/αmIL‐10‐treated group. The horizontal dashed line within the vertical points marks the mean for each group. The data represent one of at least two independent experiments with consistent results.

Effect of the IL‐10—IL‐10R pathway on the angiogenic activity of HUVECs in vitro. (A, B) HUVECs were treated with medium alone (CON), rhIL‐10 (10 U/ml, unless otherwise indicated), hIL‐10 mAb (10 µg/ml, unless otherwise indicated), or hIL‐10R mAb (10 µg/ml, unless otherwise indicated) for migration assays and tube formation assays. (C, D) CM from treated ectopic EN‐MSCs (Ec) was cultured with HUVECs for the migration assay and the tube formation assay. CM from human eutopic EN‐MSCs (Eu) was used as a cell type control. HUVECs treated with medium alone served as a negative control (CON). (E) Representative western blotting for VEGF, p‐STAT3, total STAT3, and β‐actin in treated HUVEC cells as shown in A. (F) HUVECs were transfected with scrambled siRNA (scramble) or with VEGF‐specific siRNA at 25 or 50 nm for 12 h, followed by western blotting for VEGF and β‐actin in treated HUVECs. Each immunoblot was quantified for the target protein relative to its corresponding β‐actin levels. Results are shown as ratios that were normalised to the corresponding CON sample. These are representative blots from three independent experiments. (G, H) Tube formation of HUVECs after treatment with scrambled siRNA, VEGF siRNA at 25 nm in PBS, or VEGF siRNA at 25 nm together with rhIL‐10 for 12 h. Results (mean ± SD) shown in A–D and H are from three independent experiments.

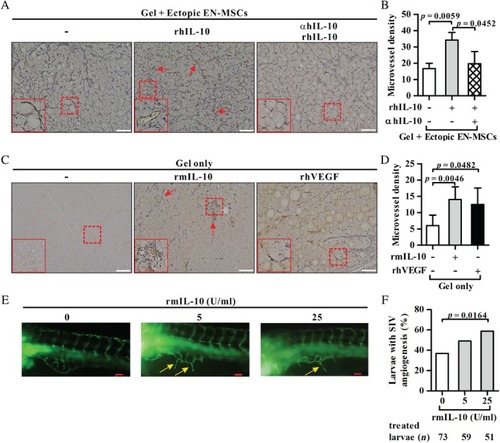
Effect of the IL‐10—IL‐10R pathway on angiogenesis in vivo. (A, C) Matrigel plugs containing ectopic EN‐MSCs mixed with recombinant proteins as indicated (A) or recombinant proteins alone as indicated (C) were implanted into female NUDE mice. Representative photomicrographs of paraformaldehyde‐fixed sections from the Matrigel plugs stained with anti‐mCD31 (brown) and haematoxylin (blue) are shown. The insets (solid box) show two‐fold enlarged images of microvascular structures (dashed box). Arrows indicate microvascular structures. Scale bars = 100 µm. (B, D) Microvessel density was evaluated based on the number of CD31+ haematoxylin+ cells per square millimetre. The experiments were repeated at least three times, and the data are presented as the mean ± SD (n = 3 mice in each group in B; n = 3–6 mice in each group in D). (E) The yolk sac of 72 h post‐fertilisation zebrafish embryos was injected with PBS or with 5 or 25 U/ml rmIL‐10 in PBS. Representative photographs taken 24 h after injection using an epifluorescence microscope show the angiogenesis of the SIV (yellow arrows) in the resulting zebrafish larvae. Scale bars = 50 µm. The number of treated larvae in each group is indicated. (F) The percentage of larvae with angiogenesis of the SIV is shown for each of the three groups. Student's unpaired t‐test was performed in B and D, and Fisher's exact test in F.

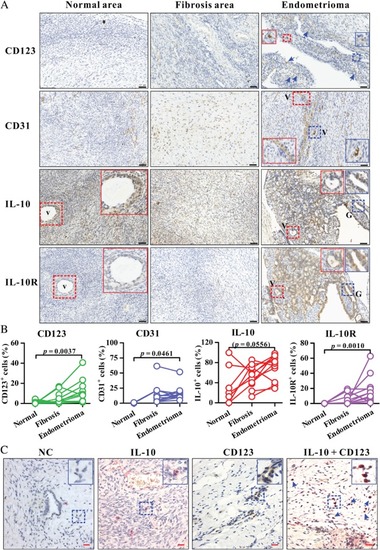
Analysis of CD123, CD31, IL‐10, and IL‐10R expression in human endometrioma and uterine endometrial tissues. (A) Immunohistochemistry for CD123, CD31, IL‐10, or IL‐10R (brown colour) in a representative endometrioma lesion as well as the fibrosis area and normal area surrounding the corresponding endometrioma lesion. The insets (solid box) show two‐fold enlarged images of vascular structure (V) or glandular epithelium (G) (dashed box) with the same colour. Arrows indicate CD123+ cells. Blue, haematoxylin counterstain. Black scale bars = 50 µm. The enlarged images of IL‐10 and IL‐10R expression on endometrioma lesions in A are shown in supplementary material, Figure S7 for clear presentation. (B) Quantification of positive cell frequencies in each endometrioma lesion and corresponding fibrosis area and/or normal tissue analysed by HistoQuest software. Number of endometrioma lesion samples: 11 for all markers; number of fibrosis areas within the endometrioma lesion samples: 11 for all markers; number of normal regions within the endometrioma lesion samples: 8 for CD123, 2 for CD31, 7 for IL‐10, and 5 for IL‐10R. p < 0.05 was considered significant based on the Kruskal–Wallis test and then Dunn's multiple comparison test. (C) Double immunohistochemical staining for IL‐10 (red) or/and CD123 (brown) in a representative human endometrioma lesion. NC, negative control with omission of both primary antibodies. The insets (solid box) show two‐fold enlarged images of positive cells as indicated (dashed box). Arrows indicate IL‐10+ CD123+ pDCs with voluminous cytoplasm and smooth cell surface. Blue, haematoxylin counterstain. Red scale bars = 20 µm.

Schematic representation of the effect and immune cell sources of IL‐10 during the early and late stages of endometriosis. During the early implantation and invasion stages, lesion pDCs may secrete IL‐10 in response to unwanted and apoptotic cells. Local IL‐10 further promotes lesion growth by either suppressing anti‐ectopic fragment immunity or stimulating angiogenesis in VEGF‐dependent and ‐independent pathways. In addition, IL‐10—IL‐10R signalling may stimulate endometrial cell migration. The complex interaction among genetic factors, endogenous hormones, environmental endocrine disruptors (EEDs), and impaired immune surveillance leads to chronic inflammation. In the context of chronic inflammation in the peritoneal cavity, other immune cells, such as alternative activated macrophages and Th17 cells as well as endometrial cells (not shown here), can secrete IL‐10 and other mediators to further promote the growth and maintenance of ectopic implants.

Acknowledgments
This image is the copyrighted work of the attributed author or publisher, and ZFIN has permission only to display this image to its users. Additional permissions should be obtained from the applicable author or publisher of the image. Full text @ J. Pathol.