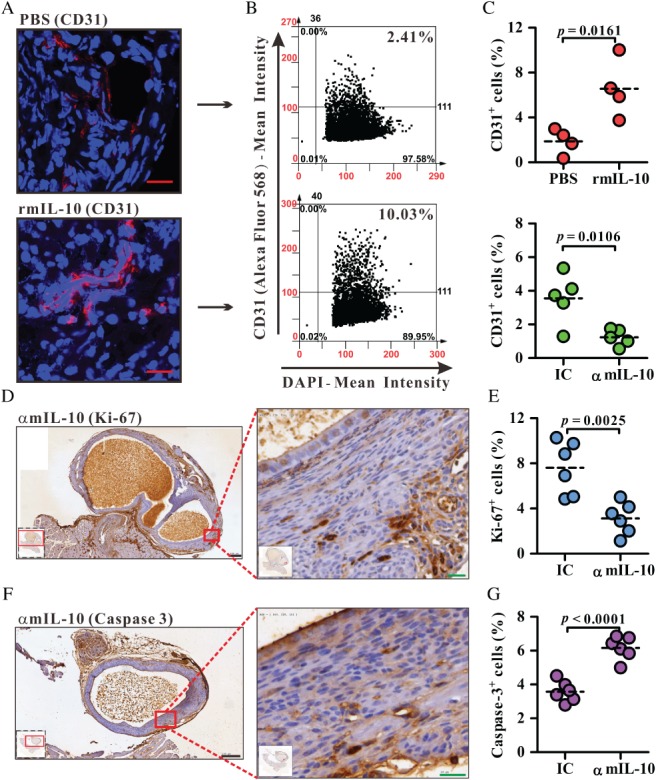
IMAGE

Figure 2

ID
ZDB-IMAGE-191230-1294
Source
Figures for Suen et al., 2019
Image
Figure Caption

Figure 2

Quantification of CD31+ cells in endometriotic lesions in the murine model. (A) Representative immunofluorescence sections of lesions from PBS‐ or rmIL‐10‐treated mice. Blue, nucleus (DAPI); red, CD31 (Alexa Fluor 568). Red scale bars = 20 µm. (B) Representative dot plots analysed by TissueQuest software. (C) The frequency of CD31+ cells among DAPI+ cells in the whole field of each lesion. IC, isotype control; αmIL‐10, mAb against mouse IL‐10. One dot represents one section from each endometriotic lesion. One endometriotic lesion was sampled per mouse. n = 4 mice in the PBS/rmIL‐10‐treated group; n = 5 mice in the IC/αmIL‐10‐treated group. (D, E) Representative immunohistochemistry sections of lesions for Ki‐67 or active caspase‐3 (brown colour) from αmIL‐10‐treated mice. Blue, haematoxylin counterstain. Black scale bar (left panels) = 200 µm; green scale bar (right panels) = 20 µm. (F, G) The frequency of Ki‐67+ cells or active caspase‐3+ cells among haematoxylin+ cells in the whole field of each lesion. One dot represents one section from each endometriotic lesion. Two endometriotic lesions per treatment were from one mouse. n = 3 mice in the IC/αmIL‐10‐treated group. The horizontal dashed line within the vertical points marks the mean for each group. The data represent one of at least two independent experiments with consistent results.

Acknowledgments
This image is the copyrighted work of the attributed author or publisher, and ZFIN has permission only to display this image to its users. Additional permissions should be obtained from the applicable author or publisher of the image. Full text @ J. Pathol.