
- Title
-
Transcriptional Enhancers in the FOXP2 Locus Underwent Accelerated Evolution in the Human Lineage
- Authors
- Caporale, A.L., Gonda, C.M., Franchini, L.F.
- Source
- Full text @ Mol Bio Evol
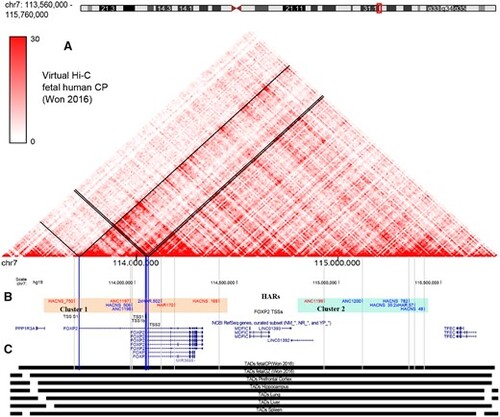
The FOXP2-TAD contains two clusters of HARs. (A) Virtual Hi–C contact matrix obtained from midgestational developing human cortical plate (Won et al. 2016). FOXP2-alternative TSS interactions are showed as black lines over the matrix. (B) Diagram obtained from UCSC Genome Browser showing the FOXP2 locus on chromosome 7 (7q31.1) of the human genome (hg19). FOXP2-TSSs are indicated as blue bars. HARs genome coordinates were obtained from an assembly of available HARs (Capra et al. 2013), and each element conserved its name from the original database that generated it (Pollard, Salama, Lambert, et al. 2006; Prabhakar et al. 2006; Bird et al. 2007; Lindblad-Toh et al. 2011). HARs are indicated by gray bars. Active elements from this study are in red, while non-active HARs are in blue. Cluster 1 contains seven HARs (light orange block). Cluster 2 contains five HARs located downstream to the FOXP2 locus (light blue block). (C) The whole region is located inside the same TAD, and this topological region seems to be conserved through several tissues (Schmitt et al. 2016; Won et al. 2016). |
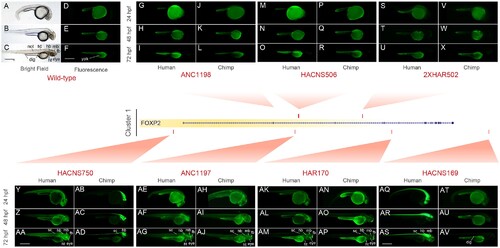
Comparative functional characterization of Cluster 1 FOXP2-HARs using transgenic zebrafishes. Fluorescent microphotographs showing the EGFP expression pattern driven by the human or chimpanzee ortholog of each FOXP2-HARs. In addition, bright field (A–C) and fluorescent (D–F) images of wild-type zebrafish are shown. ANC1198-Hs at 24 (G), 48 (H), and 72 hpf (I); ANC1198-Pt at 24 (J), 48 (K), and 72 hpf (L); HACNS506-Hs at 24 (M), 48 (N), and 72 hpf (O); HACNS506-Pt at 24 (P), 48 (Q), and 72 hpf (R); 2xHAR502-Hs at 24 (S), 48 (T), and 72 hpf (U); 2xHAR502-Pt at 24 (V), 48 (W), and 72 hpf (X); HACNS750-Hs at 24 (Y), 48 (Z), and 72 hpf (AA); HACNS750-Pt at 24 (AB), 48 (AC), and 72 hpf (AD); ANC1197-Hs at 24 (AE), 48 (AF), and 72 hpf (AG); ANC1197-Pt at 24 (AH), 48 (AI), and 72 hpf (AJ); HAR170-Hs at 24 (AK), 48 (AL), and 72 hpf (AM); HAR170-Pt at 24 (AN), 48 (AO), and 72 hpf (AP); HACNS169-Hs at 24 (AQ), 48 (AR), and 72 hpf (AS); HACNS169-Pt at 24 (AT), 48 (AU), and 72 hpf (AV). Only one selected transgenic line for each sequence is showed. All the Cluster 1 transgenic lines are shown in figure S4, Supplementary Material online. Note that the yolk sac (yolk) of the fishes emits autofluorescence. fb, forebrain (includes telencephalon, diencephalon, and thalamus); mb, midbrain (includes tectum); hb, hindbrain; sc, spinal cord; dig, digestive tube. Scale bar: 500 µm. |
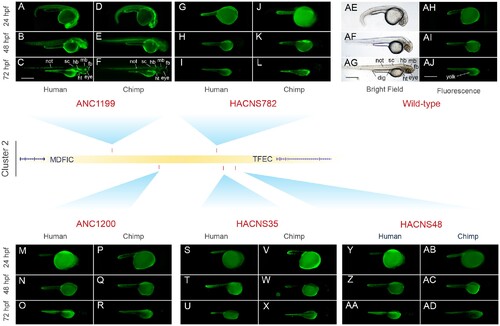
Comparative functional characterization of Cluster 2 FOXP2-HARs using transgenic zebrafishes. Fluorescent microphotographs showing the EGFP expression pattern driven by the human or chimpanzee ortholog of each FOXP2-HARs. In addition, bright field (AE–AG) and fluorescent (AH–AJ) images of wild-type zebrafish are shown. ANC1199-Hs at 24 (A), 48 (B), and 72 hpf (C); ANC1199-Pt at 24 (D), 48 (E), and 72 hpf (F); HACNS782-Hs at 24 (G), 48 (H), and 72 hpf (I); HACNS782-Pt at 24 (J), 48 (K), and 72 hpf (L); ANC1200-Hs at 24 (M), 48 (N), and 72 hpf (O); ANC1200-Pt at 24 (P), 48 (Q), and 72 hpf (R); HACNS35-Hs at 24 (S), 48 (T), and 72 hpf (U); HACNS35-Pt at 24 (V), 48 (W), and 72 hpf (X); HACNS48-Hs at 24 (Y), 48 (Z), and 72 hpf (AA); HACNS48-Pt at 24 (AB), 48 (AC), and 72 hpf (AD). Only one selected transgenic line for each sequence is showed. All the Cluster 2 transgenic lines are shown in figure S5, Supplementary Material online. Note that the yolk sac (yolk) of the fishes emits autofluorescence. fb, forebrain (includes telencephalon, diencephalon, and thalamus); mb, midbrain (includes tectum); hb, hindbrain; sc, spinal cord; ht, heart; dig, digestive tube; not, notochord. Scale bar: 500 μm |

Detailed foxP2 expression analysis in zebrafish. (A) Bright field microphotographs of developing wild-type zebrafish. (B) foxP2 WMISH at 24 (B1), 48 (B2), and 72 hpf (B3) showing the endogenous expression in zebrafish. Scale bar: 500 μm. (C) Bright field image of a wild-type zebrafish at 72 hpf where red lines indicate the approximate location of the coronal cryosections shown below. Serial cryostat sections showing chromogenic ISH (D1, E1, F1, G1), fluorescent ISH (D2, E2, F2, G2) and IHC (D3, E3, F3, G3) to detect endogenous foxP2. Confocal microphotographs showing merged images of ISH (E4a) and IHC (E4b) realized on the same cryostat section. Double-positive cells in the tectum are indicated by arrowheads in E4c. Scale bar (E4): 100 μm, Scale bar (E4c): 10 μm. cb, cerebellum; di, diencephalon; hb, hindbrain; mhb, midbrain–hindbrain boundary; not, notochord; ov, otic vesicle; sc, spinal cord; tec, tectum; tel, telencephalon; tal, thalamus (tal); y, yolk sac. |

HACNS750-Hs drives EGFP to foxP2 expressing cells. (A) Double IHC assay was performed on HACNS750-human transgenic zebrafish at 72 hpf. White lines indicate the approximately location of the coronal cryosections (B, C). Insets are marked as white boxes in B1, C1, C2. The element drives EGFP (B1b, C1b, C2b) to foxP2 (B1a, C1a, C1b) expressing cells (arrowheads) in telencephalon (tel) (B1c), tectum (tec) (C1c), and thalamus (tal) (C2c). Scale bar: 50 µm. (D) Quantification of double-positive cells regarding total EGFP cells. For tel, n = 3; for tec and tal, n = 2. Means and SD were graphed. |

HACNS169-Hs drives EGFP to foxP2 expressing cells. (A) Double IHC assay was performed on HACNS169-human transgenic zebrafish at 72 hpf. White lines indicate the approximately location of the coronal cryosections (B, C). Insets are marked as white boxes in B1, B2, C1. The element drives EGFP (B1b, B2b, C1b) to foxP2 (B1a, B2a, C1a) expressing cells (arrowheads) in tectum (tec) (B1c), thalamus (tal) (B2c), and hindbrain (hb) (C1c). Scale bar: 50 µm. (D) Quantification of double-positive cells regarding total EGFP cells. For tec and tal, n = 3; for hb, n = 2. Means and SD were graphed. |