
Fig. 3
- ID
- ZDB-FIG-240702-21
- Publication
- Caporale et al., 2019 - Transcriptional Enhancers in the FOXP2 Locus Underwent Accelerated Evolution in the Human Lineage
- Other Figures
- All Figure Page
- Back to All Figure Page
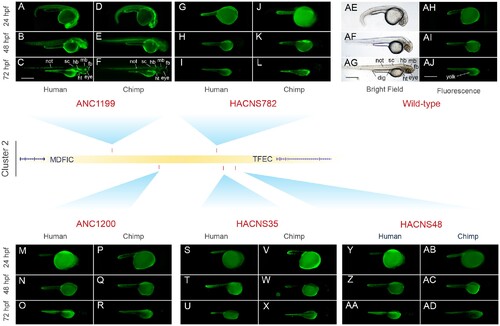
Comparative functional characterization of Cluster 2 FOXP2-HARs using transgenic zebrafishes. Fluorescent microphotographs showing the EGFP expression pattern driven by the human or chimpanzee ortholog of each FOXP2-HARs. In addition, bright field (AE–AG) and fluorescent (AH–AJ) images of wild-type zebrafish are shown. ANC1199-Hs at 24 (A), 48 (B), and 72 hpf (C); ANC1199-Pt at 24 (D), 48 (E), and 72 hpf (F); HACNS782-Hs at 24 (G), 48 (H), and 72 hpf (I); HACNS782-Pt at 24 (J), 48 (K), and 72 hpf (L); ANC1200-Hs at 24 (M), 48 (N), and 72 hpf (O); ANC1200-Pt at 24 (P), 48 (Q), and 72 hpf (R); HACNS35-Hs at 24 (S), 48 (T), and 72 hpf (U); HACNS35-Pt at 24 (V), 48 (W), and 72 hpf (X); HACNS48-Hs at 24 (Y), 48 (Z), and 72 hpf (AA); HACNS48-Pt at 24 (AB), 48 (AC), and 72 hpf (AD). Only one selected transgenic line for each sequence is showed. All the Cluster 2 transgenic lines are shown in figure S5, Supplementary Material online. Note that the yolk sac (yolk) of the fishes emits autofluorescence. fb, forebrain (includes telencephalon, diencephalon, and thalamus); mb, midbrain (includes tectum); hb, hindbrain; sc, spinal cord; ht, heart; dig, digestive tube; not, notochord. Scale bar: 500 μm |