
Image
|
Figure Caption
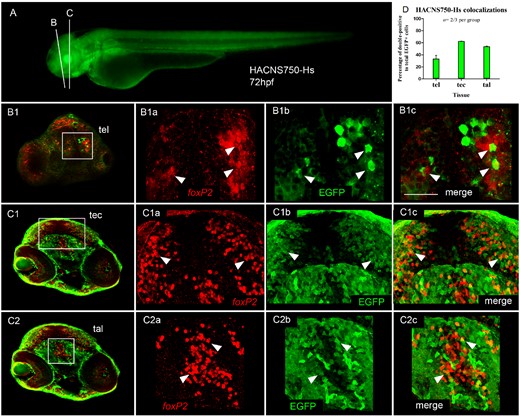
Fig. 5 HACNS750-Hs drives EGFP to foxP2 expressing cells. (A) Double IHC assay was performed on HACNS750-human transgenic zebrafish at 72 hpf. White lines indicate the approximately location of the coronal cryosections (B, C). Insets are marked as white boxes in B1, C1, C2. The element drives EGFP (B1b, C1b, C2b) to foxP2 (B1a, C1a, C1b) expressing cells (arrowheads) in telencephalon (tel) (B1c), tectum (tec) (C1c), and thalamus (tal) (C2c). Scale bar: 50 µm. (D) Quantification of double-positive cells regarding total EGFP cells. For tel, n = 3; for tec and tal, n = 2. Means and SD were graphed.
Acknowledgments
This image is the copyrighted work of the attributed author or publisher, and
ZFIN has permission only to display this image to its users.
Additional permissions should be obtained from the applicable author or publisher of the image.
Full text @ Mol Bio Evol