FIGURE SUMMARY
Title

Loss of atrx cooperates with p53-deficiency to promote the development of sarcomas and other malignancies

Authors
Oppel, F., Tao, T., Shi, H., Ross, K.N., Zimmerman, M.W., He, S., Tong, G., Aster, J.C., Look, A.T.
Source
Full text @ PLoS Genet.

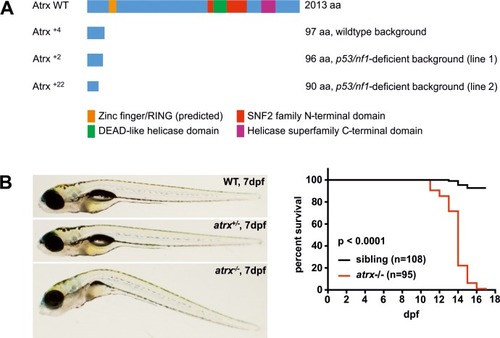
CRISPR/Cas9-mediated knockout of <italic>atrx</italic> in zebrafish germline.

(A) The wildtype (WT) Atrx protein consists of 2013 amino acids (aa). Targeting of the atrx coding sequence with CRISPR/Cas9 resulted in truncation of Atrx before its functional domains and confers a loss of function; numbers indicate the underlying genetic alterations, e.g., +4 = insertion of 4 bases. (B)atrx-/- embryos show developmental abnormalities and die within 18 days post fertilization (dpf); sibling includes both atrx+/- and atrx+/+ embryos.

PHENOTYPE:
Fish:
Observed In:
Stage Range: Days 7-13 to Days 14-20

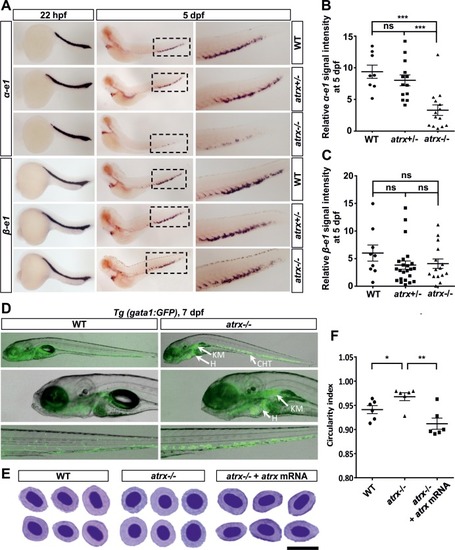
Homozygous loss of <italic>atrx</italic> results in an α-thalassemia-like phenotype in zebrafish development.

(A) Whole-mount in situ hybridization for α-e1 and β-e1 globins in wildtype (WT), atrx+/- heterozygous fish and atrx-/- homozygous mutants at 22 hpf and 5 dpf as indicated. Boxes outline the CHT region at 5 dpf, and are magnified in the right panels. Globin signal intensities of α-e1(B) and β-e1(C) in fish with different atrx backgrounds were calculated at 5dpf. Horizontal bars indicate the means ± SEM, which were compared with the two-tailed unpaired t-test; ns = not significant; ***p<0.001. (D) Erythroid progenitors development visualized by GFP in the Tg(gata1:GFP) transgenic line with wildtype (WT) or atrx-/- background at 7 dpf. CHT = caudal hematopoietic tissue; H = heart; KM = kidney marrow; dpf = days post fertilization. (E) Analysis of peripheral blood smears by MGG staining in wildtype fish (WT), atrx-/- homozygous mutant and atrx-/- homozygous mutant injected with zebrafish atrx mRNA at 7 dpf; scale bar: 10 μm. (F) Circularity index for the erythroid cells from fish with different atrx backgrounds (E) was calculated by ImageJ. Horizontal bars indicate the means ± SEM, which were compared with the two-tailed unpaired t-test; *p<0.05; **p<0.01.

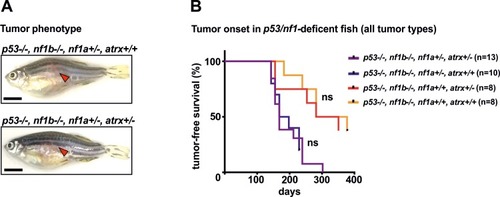
Addition of frameshift-mutations in <italic>atrx</italic> to the <italic>p53/nf1</italic>-deficient background induces specific changes in tumor biology.

(A) The morphologic features of p53/nf1/atrx- and p53/nf1-deficient tumors were indistinguishable by visual inspection. (B) When all tumor types were considered, tumor onset was not significantly altered upon heterozygous loss of atrx; a representative tumor watch experiment using line 1 is shown; the tumor watch has been reproduced in lines 1 and 2 with similar results; ns = not significant.

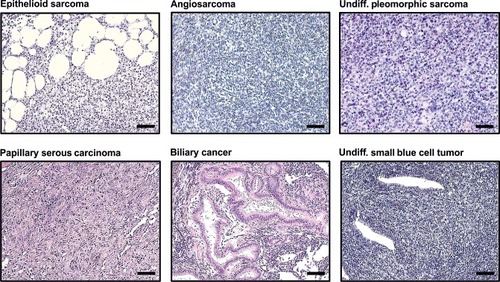
Histology of tumor types detected in <italic>atrx</italic>+/- zebrafish with <italic>p53/nf1</italic>-deficient background.

This figure shows HE-stained sections of all tumor types detected in p53-/-, nf1b-/-, nf1a+/-, atrx+/- or p53-/-, nf1b-/-, nf1a+/+, atrx+/- fish that were not observed in atrx-wildtype siblings; scale bars: 50μm.

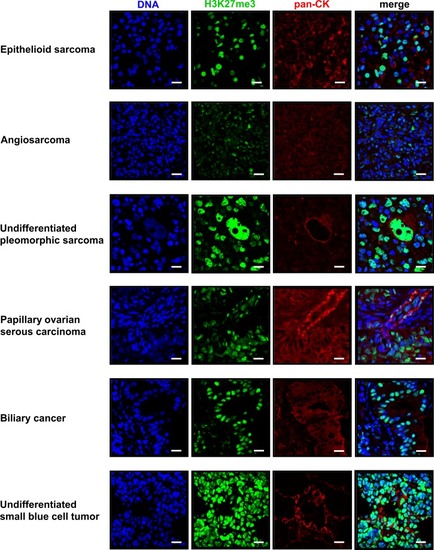
Immunofluorescence staining of tumor types detected in <italic>atrx</italic>+/- zebrafish with <italic>p53/nf1</italic>-deficient background.

This figure shows all tumor types detected in p53-/-, nf1b-/-, nf1a+/-, atrx+/- or p53-/-, nf1b-/-, nf1a+/+, atrx+/- fish that were not observed in atrx-wildtype siblings. For each tumor a section stained by indirect immunofluorescence for H3K27me3 (green) and pan-cytokeratin (red) is shown. The DNA is visualized with Hoechst (blue); scale bars: 10μm.

Loss of <italic>atrx</italic> in <italic>p53/nf1</italic>-depleted zebrafish tumors results in <italic>tert</italic> downregulation, ALT and disturbed PRC2 function.

(A) FPKM values show a significant downregulation of tert in p53/nf1/atrx-deficient fish compared to p53/nf1-kockout control fish; values were compared with the two-tailed unpaired t-test; n = 3, p = 0.0387. (B) Fluorescence in situ hybridization (FISH) using a Cy3-conjugated telomere-specific probe (TelC-Cy3, red) reveals elongated telomeres visible as large irregularly shaped spots in tumors with a knockout of p53, nf1 and atrx compared to atrx-wildtype control tumors, consistent with alternative lengthening of the telomeres; DNA stained with DAPI (blue); scale bars: 10μm; n = 6. (C) Quantification of relative telomere area in FISH images, normalized to DAPI signal area; values were compared with the two-tailed unpaired t-test; *p = 0.0151; n = 6. (D) Quantification of the relative number (#) of all detectable telomere spots in FISH images, normalized to DAPI signal area; values were compared with the two-tailed unpaired t-test; *p = 0.042; n = 6. (E) Quantification of the relative number (#) of telomere spots larger than ~1.5μm2 in FISH images, normalized to DAPI signal area; values were compared with the two-tailed unpaired t-test; *p = 0.0013; n = 6. (F) RNA-seq analysis demonstrates significantly increased expression of PRC2-target gene sets in atrx-deficient tumors; group 1: p53-/-, nf1b-/-, nf1a+/-, atrx+/+ (control); group 2: p53-/-, nf1b-/-, nf1a+/-, atrx+/-; n = 3.

Acknowledgments
This image is the copyrighted work of the attributed author or publisher, and ZFIN has permission only to display this image to its users. Additional permissions should be obtained from the applicable author or publisher of the image. Full text @ PLoS Genet.