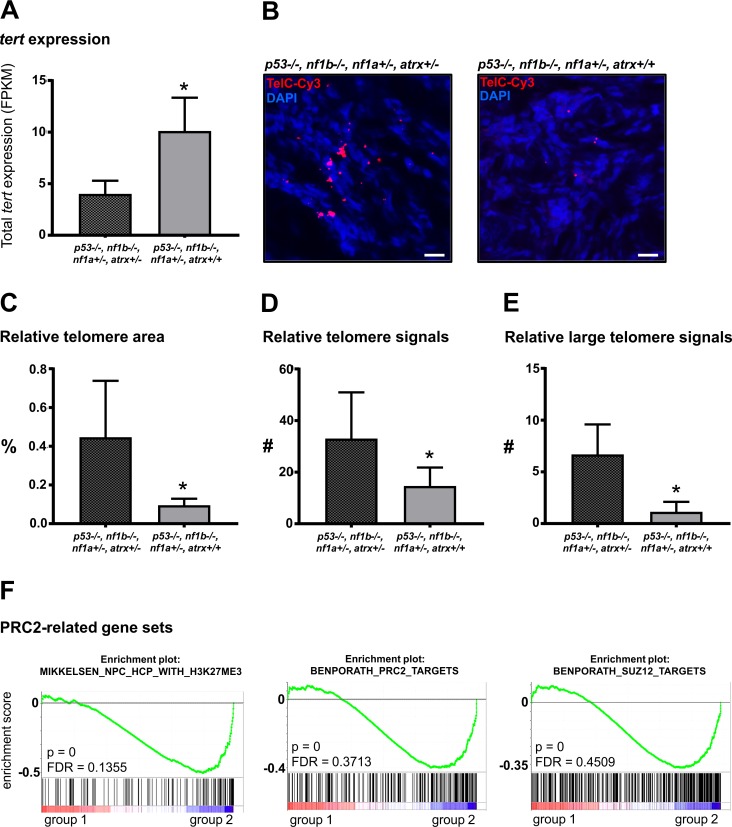
Loss of atrx in p53/nf1-depleted zebrafish tumors results in tert downregulation, ALT and disturbed PRC2 function.
(A) FPKM values show a significant downregulation of tert in p53/nf1/atrx-deficient fish compared to p53/nf1-kockout control fish; values were compared with the two-tailed unpaired t-test; n = 3, p = 0.0387. (B) Fluorescence in situ hybridization (FISH) using a Cy3-conjugated telomere-specific probe (TelC-Cy3, red) reveals elongated telomeres visible as large irregularly shaped spots in tumors with a knockout of p53, nf1 and atrx compared to atrx-wildtype control tumors, consistent with alternative lengthening of the telomeres; DNA stained with DAPI (blue); scale bars: 10μm; n = 6. (C) Quantification of relative telomere area in FISH images, normalized to DAPI signal area; values were compared with the two-tailed unpaired t-test; *p = 0.0151; n = 6. (D) Quantification of the relative number (#) of all detectable telomere spots in FISH images, normalized to DAPI signal area; values were compared with the two-tailed unpaired t-test; *p = 0.042; n = 6. (E) Quantification of the relative number (#) of telomere spots larger than ~1.5μm2 in FISH images, normalized to DAPI signal area; values were compared with the two-tailed unpaired t-test; *p = 0.0013; n = 6. (F) RNA-seq analysis demonstrates significantly increased expression of PRC2-target gene sets in atrx-deficient tumors; group 1: p53-/-, nf1b-/-, nf1a+/-, atrx+/+ (control); group 2: p53-/-, nf1b-/-, nf1a+/-, atrx+/-; n = 3.
Acknowledgments
This image is the copyrighted work of the attributed author or publisher, and
ZFIN has permission only to display this image to its users.
Additional permissions should be obtained from the applicable author or publisher of the image.
Full text @ PLoS Genet.
Your Input Welcome
Thank you for submitting comments. Your input has been emailed to ZFIN curators who may contact you if
additional information is required.
Oops. Something went wrong. Please try again later.