
Fig 2
- ID
- ZDB-IMAGE-190723-1605
- Genes
- Publication
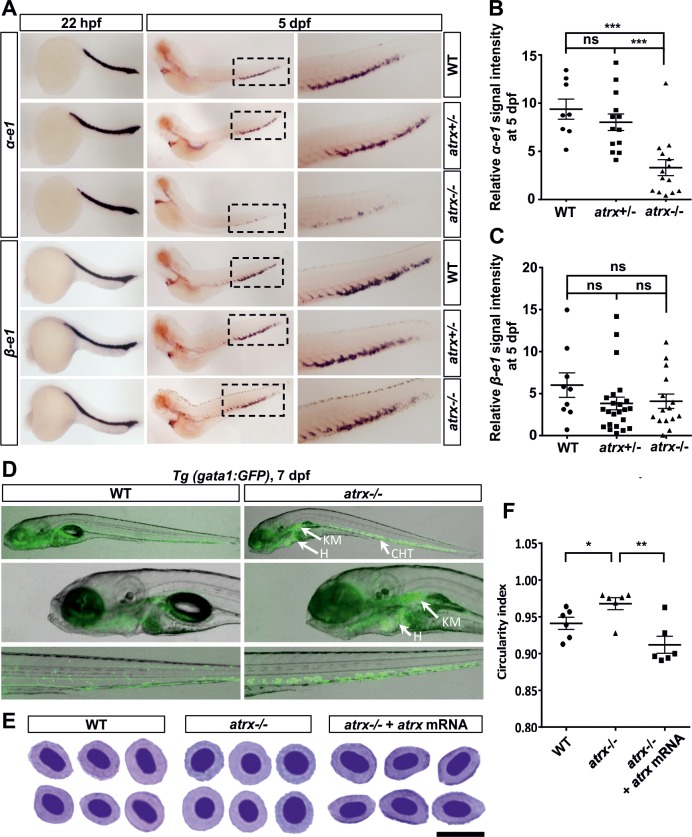
- Oppel et al., 2019 - Loss of atrx cooperates with p53-deficiency to promote the development of sarcomas and other malignancies
- All Figures
- Figures for Oppel et al., 2019
|
Fig 2