
- Title
-
Why does the zebrafish cloche mutant develop lens cataract?
- Authors
- Posner, M., McDonald, M.S., Murray, K.L., Kiss, A.J.
- Source
- Full text @ PLoS One
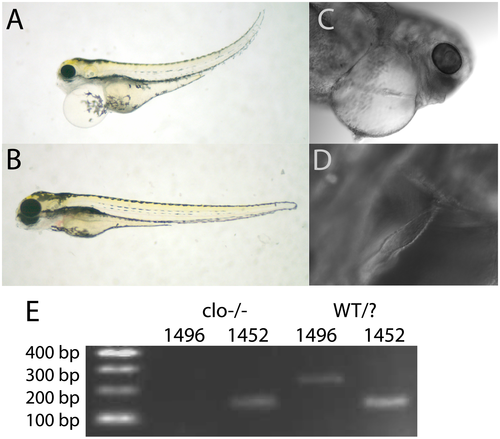
Identification of cloche embryos. View of the gross morphology of an embryo homozygous for the cloche mutant allele m39 (A) compared to a non-phenotype sibling (B) at 4 dpf. Embryos were identified by the presence of cardiac edema, lack of red blood cells and characteristic irregularly shaped heart (C and D). The presence of the m39 cloche allele in our fish was confirmed by PCR genotyping using primer sets z1496 and z1452 (E; [14]). PHENOTYPE:
|
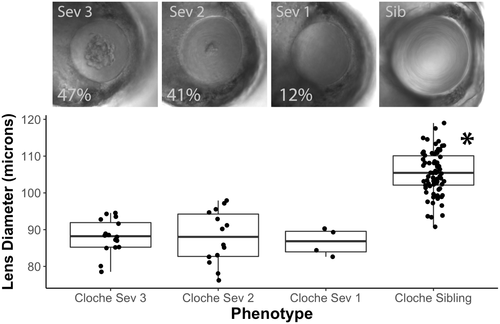
Severity of the cloche lens phenotype varies, but is not correlated with lens diameter. Cloche embryos at 4 dpf were pooled into three severity groups. Representative lenses are shown for severity groups 3, 2, and 1, with group 3 being most severe. Percentages indicate the proportion of embryos with each severity (n = 34). A representative normal lens is shown from a cloche sibling. The lens diameter in cloche embryos was uniformly reduced in all severity groups compared to siblings (ANOVA p value < 0.0001; Tukey Honest Significant Difference (HSD) post test used to identify statistically significant mean for sibling group (*)).
PHENOTYPE:
|

Quantification of retained fiber cell nuclei in cloche lenses of different phenotype severity compared to non-phenotype siblings by DAPI staining. Images above the graph show representative lenses for each severity type at 4 dpf. Fiber cell nuclei were significantly more abundant in all cloche lenses compared to siblings. Within cloche embryos, severity type 3 lenses (the most severe) contained fewer nuclei than severity type 2 or 1 (ANOVA p value < 0.0001; letters indicate statistical groups determined by Tukey Honest Significant Difference (HSD) post test). PHENOTYPE:
|

ZFIN is incorporating published figure images and captions as part of an ongoing project. Figures from some publications have not yet been curated, or are not available for display because of copyright restrictions. EXPRESSION / LABELING:
|
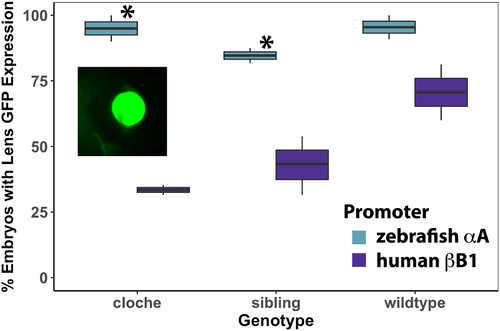
Percent of embryos with lens GFP expression after injection of zebrafish αA-crystallin promoter/GFP and human βB1-crystallin promoter/GFP plasmids. Data show that the native αA-crystallin promoter drives greater GFP expression in lens compared to the human bB1 promoter in cloche and non-phenotype siblings (Yates Corrected X2 test: X2 = 16.85, p value<0.001; X2 = 21.38, p value<0.001 respectively), but this difference was not statistically significant in wildtype embryos (X2 = 3.35, pvalue>0.05). Each box and whisker blot represents two independent experiments (except for the βB1 sibling value which included three independent experiments). Each independent experiment included between 3 and 54 embryos at 4 dpf (median = 19). Inset shows an example of GFP lens expression in a cloche embryo produced by the αA-crystallin promoter. |
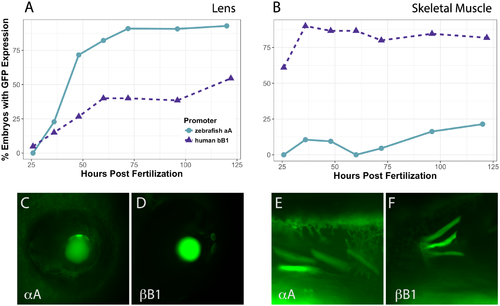
Timecourse of promoter activity in lens (A) and skeletal muscle (B) in all combined embryos. Zebrafish αA-crystallin promoter (circles) produced lens expression in a larger proportion of embryos by 36 hpf and drove GFP expression in over 85% of embryos by 72 hpf. The human βB1-crystallin promoter (triangles) drove surprisingly abundant expression in zebrafish skeletal muscle, but was less active in lens. Between 11 and 66 embryos were observed for each timepoint. Images C-F show representative examples of GFP expression with each promoter as indicated in lens (C and D) and skeletal muscle (E and F). |