
- Title
-
Folic acid-nanoscale gadolinium-porphyrin metal-organic frameworks: fluorescence and magnetic resonance dual-modality imaging and photodynamic therapy in hepatocellular carcinoma
- Authors
- Chen, Y., Liu, W., Shang, Y., Cao, P., Cui, J., Li, Z., Yin, X., Li, Y.
- Source
- Full text @ Int. J. Nanomedicine
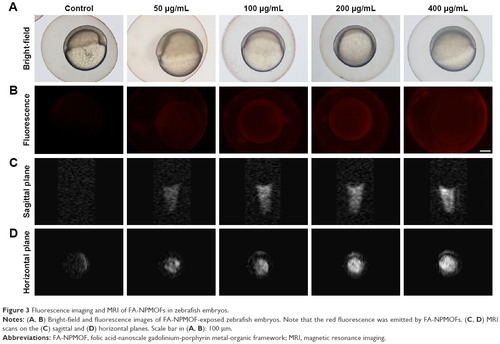
Fluorescence imaging and MRI of FA-NPMOFs in zebrafish embryos. Notes: (A, B) Bright-field and fluorescence images of FA-NPMOF-exposed zebrafish embryos. Note that the red fluorescence was emitted by FA-NPMOFs. (C, D) MRI scans on the (C) sagittal and (D) horizontal planes. Scale bar in (A, B): 100 μm. Abbreviations: FA-NPMOF, folic acid-nanoscale gadolinium-porphyrin metal-organic framework; MRI, magnetic resonance imaging. |
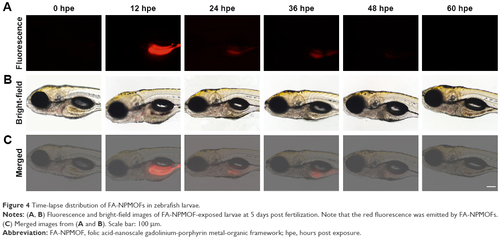
Time-lapse distribution of FA-NPMOFs in zebrafish larvae. Notes: (A, B) Fluorescence and bright-field images of FA-NPMOF-exposed larvae at 5 days post fertilization. Note that the red fluorescence was emitted by FA-NPMOFs. (C) Merged images from (A and B). Scale bar: 100 μm. Abbreviation: FA-NPMOF, folic acid-nanoscale gadolinium-porphyrin metal-organic framework; hpe, hours post exposure. |
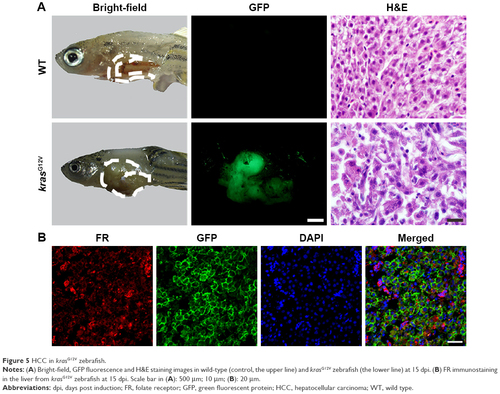
HCC in krasG12V zebrafish. Notes: (A) Bright-field, GFP fluorescence and H&E staining images in wild-type (control, the upper line) and krasG12V zebrafish (the lower line) at 15 dpi. (B) FR immunostaining in the liver from krasG12V zebrafish at 15 dpi. Scale bar in (A): 500 μm; 10 μm; (B): 20 μm. Abbreviations: dpi, days post induction; FR, folate receptor; GFP, green fluorescent protein; HCC, hepatocellular carcinoma; WT, wild type. |
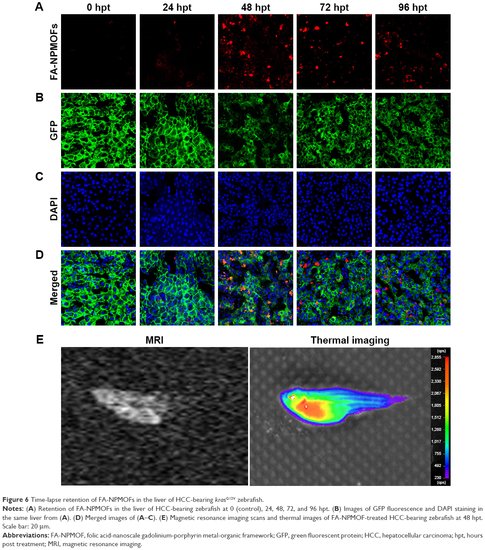
Time-lapse retention of FA-NPMOFs in the liver of HCC-bearing krasG12V zebrafish. Notes: (A) Retention of FA-NPMOFs in the liver of HCC-bearing zebrafish at 0 (control), 24, 48, 72, and 96 hpt. (B) Images of GFP fluorescence and DAPI staining in the same liver from (A). (D) Merged images of (A–C). (E) Magnetic resonance imaging scans and thermal images of FA-NPMOF-treated HCC-bearing zebrafish at 48 hpt. Scale bar: 20 μm. Abbreviations: FA-NPMOF, folic acid-nanoscale gadolinium-porphyrin metal-organic framework; GFP, green fluorescent protein; HCC, hepatocellular carcinoma; hpt, hours post treatment; MRI, magnetic resonance imaging. |
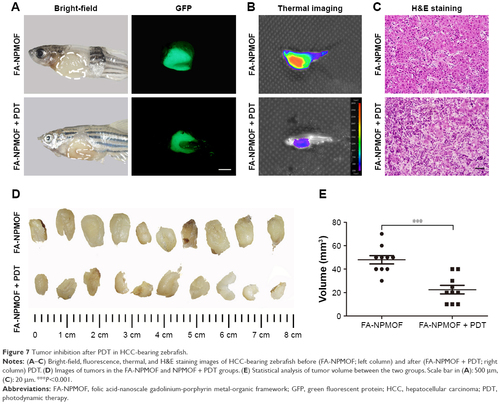
Tumor inhibition after PDT in HCC-bearing zebrafish. Notes: (A–C) Bright-field, fluorescence, thermal, and H&E staining images of HCC-bearing zebrafish before (FA-NPMOF; left column) and after (FA-NPMOF + PDT; right column) PDT. (D) Images of tumors in the FA-NPMOF and NPMOF + PDT groups. (E) Statistical analysis of tumor volume between the two groups. Scale bar in (A): 500 μm, (C): 20 μm. ***P<0.001. Abbreviations: FA-NPMOF, folic acid-nanoscale gadolinium-porphyrin metal-organic framework; GFP, green fluorescent protein; HCC, hepatocellular carcinoma; PDT, photodynamic therapy. |