
Image
|
Figure Caption
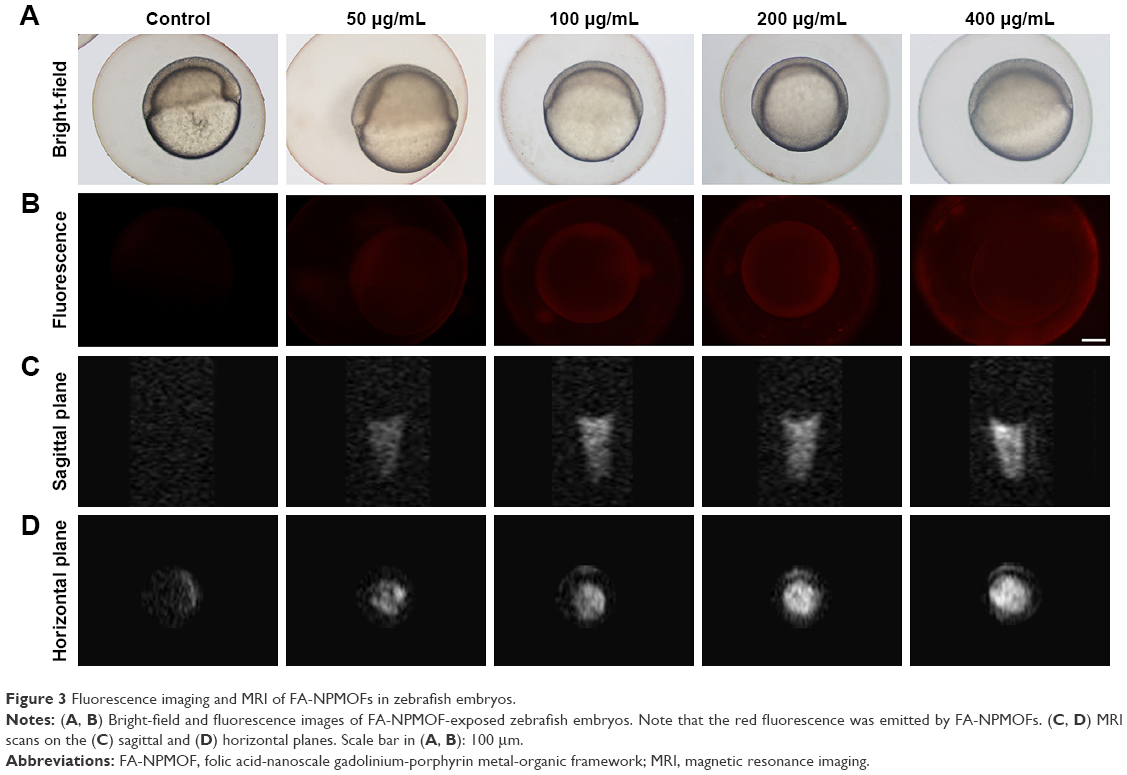
Fig. 3 Fluorescence imaging and MRI of FA-NPMOFs in zebrafish embryos. Notes: (A, B) Bright-field and fluorescence images of FA-NPMOF-exposed zebrafish embryos. Note that the red fluorescence was emitted by FA-NPMOFs. (C, D) MRI scans on the (C) sagittal and (D) horizontal planes. Scale bar in (A, B): 100 μm. Abbreviations: FA-NPMOF, folic acid-nanoscale gadolinium-porphyrin metal-organic framework; MRI, magnetic resonance imaging.
Acknowledgments
This image is the copyrighted work of the attributed author or publisher, and
ZFIN has permission only to display this image to its users.
Additional permissions should be obtained from the applicable author or publisher of the image.
Full text @ Int. J. Nanomedicine