
Image
|
Figure Caption
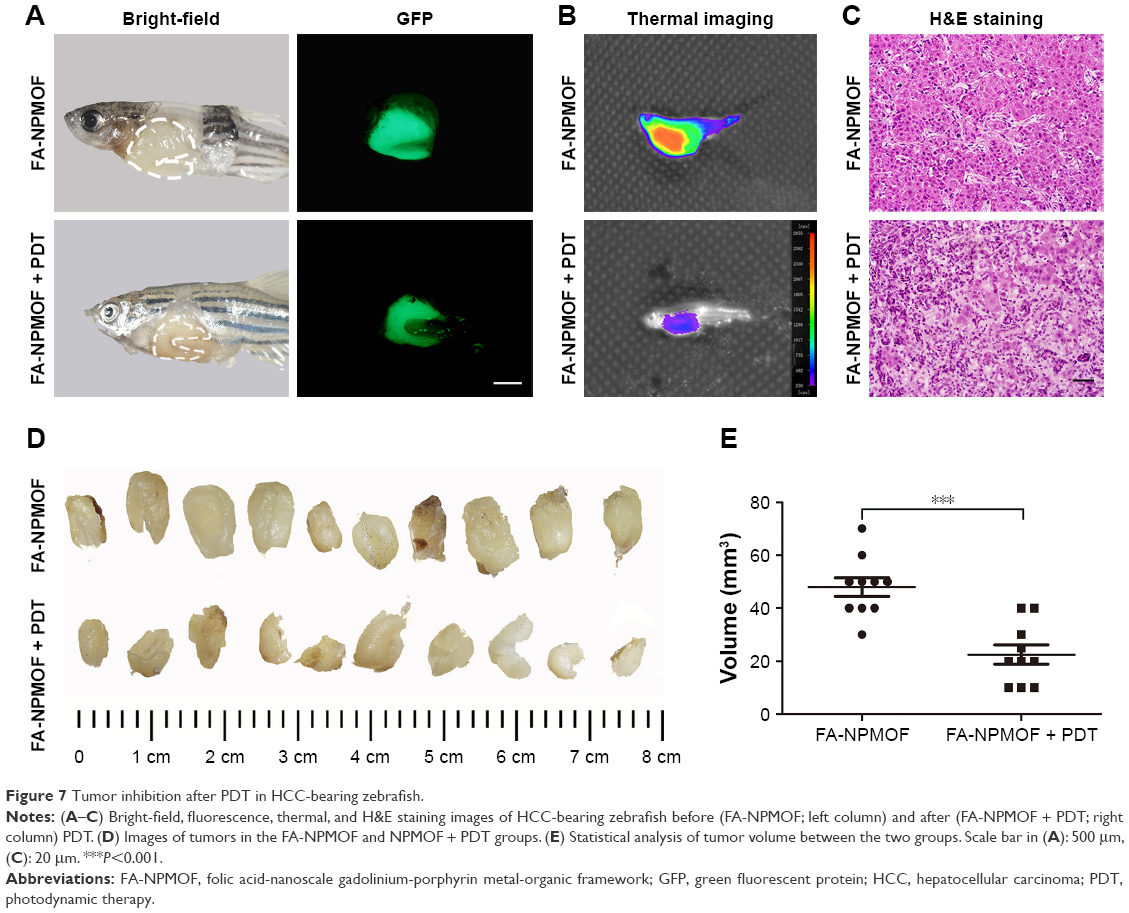
Fig. 7 Tumor inhibition after PDT in HCC-bearing zebrafish. Notes: (A–C) Bright-field, fluorescence, thermal, and H&E staining images of HCC-bearing zebrafish before (FA-NPMOF; left column) and after (FA-NPMOF + PDT; right column) PDT. (D) Images of tumors in the FA-NPMOF and NPMOF + PDT groups. (E) Statistical analysis of tumor volume between the two groups. Scale bar in (A): 500 μm, (C): 20 μm. ***P<0.001. Abbreviations: FA-NPMOF, folic acid-nanoscale gadolinium-porphyrin metal-organic framework; GFP, green fluorescent protein; HCC, hepatocellular carcinoma; PDT, photodynamic therapy.
Acknowledgments
This image is the copyrighted work of the attributed author or publisher, and
ZFIN has permission only to display this image to its users.
Additional permissions should be obtained from the applicable author or publisher of the image.
Full text @ Int. J. Nanomedicine