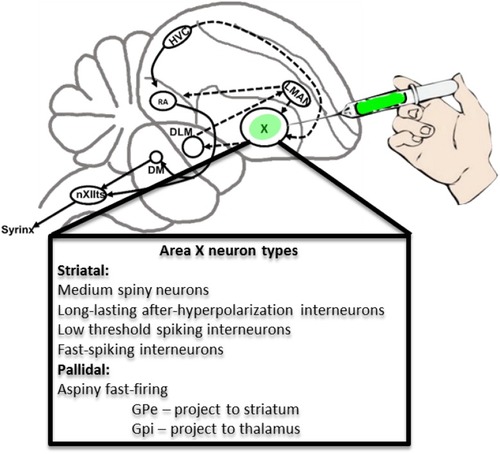
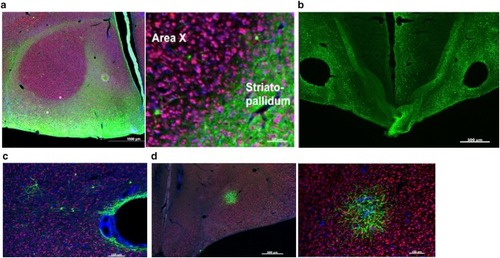
Song control circuitry including neuronal phenotypes of striato-pallidal Area X. Sagittal schematic illustrates major components of the song control system. The basal ganglia nucleus dedicated to vocal learning, Area X, is shown as the target of stereotaxic injections with viruses that encode fluorescent reporter proteins. Abbreviations are described in the list. Below, the basic neuronal phenotypes that comprise Area X are shown (Farries and Perkel 2002; Farries et al. 2005; Goldberg and Fee 2010a, b)

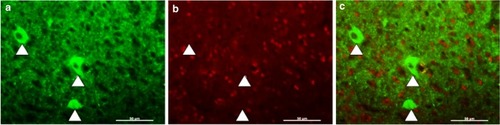
FoxP2 is not co-expressed in pallidal neurons labeled by anti-Lant6 antibody. a Anti-Lant6 antibody labels three large cells (arrowheads) in a tissue section containing Area X. b Anti-FoxP2 antibody signals appear enriched in nuclei that are distinct from the cells labeled in (a). c Merged images show no overlap between the pallidal marker Lant6 (green) and FoxP2 (red). Scale bar 50 uM

Characterization of three lentiviruses obtained from the UCLA viral vector core for their ability to transduce Area X neurons. aTop control (left) and experimental (right) constructs are depicted. Below photomicrographs show GFP expression levels following injection into Area X. These viruses achieved sparse GFP expression that could only be detected using a GFP antibody in sections that received the control construct (e.g., left panel). Little to no GFP was observed in the contralateral hemisphere injected with the experimental virus, despite immunological enhancement with an anti-GFP antibody (right panel). Scale bar 100 uM. b Photomicrographs of Area X from a bird brain injected with ultra-centrifuged hSyn1 lentivirus. GFP is shown as green. The tissue was counterstained for NeuN (red) and DAPI (blue). No fluorescence was detected without an anti-GFP antibody. Top left image shows GFP positive signal following conventional immunohistochemical enhancement anti-GFP antibody. A higher magnification of the same section (top right). Bottom images show enhancement of GFP signal following TSA amplification. Despite enhancement, the infection was sparse with few GFP-positive cell bodies. c Photomicrograph shows lesion site in Area X following injection of lentivirus containing the PGK promoter. Scale bar 100 μm

AAV hSyn1 GFP transduces HVC neurons. Photomicrographs show NeuN-positive neurons (red; right panels), GFP reporter signals (green; middle panels) and merged images (left panels). a Low magnification images show HVC (arrowheads denote ventral border) as the slight increase in neuronal density lying just superficial to the thin hyperpallial layer. Scale bar 500 μm. b Higher magnification is shown in left and middle panels. c Merge of even higher power image illustrates that only NeuN positive cells are transduced

Characterization of four AAVs obtained from the U Penn viral vector core for their ability to transduce Area X neurons. In all panels, green signals show GFP, red signals show NeuN, and blue signals show DAPI staining. aLeft photomicrograph reveals that AAV2/5 transfects large portions of the brain except for Area X. Scale bar 1000 μm. Right higher magnification shows robust transduction in the striatopallidum outlying Area X. Scale bar 50 μm. b AAV2/1 shows robust transduction but also induces lesions at the injection site. Scale bar 500 μm. c Representative photomicrograph shows that AAV2/rh10 has a low transfection rate in Area X and induces a lesion at the injection site. Scale bar 500 μm. dRight photomicrograph shows low levels of transduction by AAV2/8. Scale bar 500 μm. Even at higher magnification (right), there were very few GFP-positive cell bodies in the most densely transfected region. Scale bar 100 μm

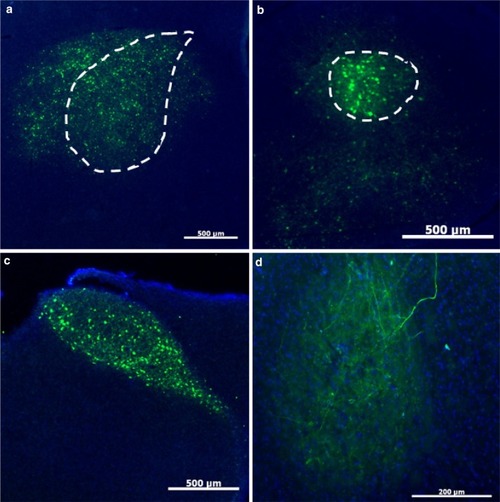
U Penn AAV2/1-CB7-GFP retrogradely infects at least one, if not more, Area X afferent nuclei. a High numbers of GFP-positive cells are visible at the injection site in Area X (dotted outline). Scale bar 500 μm. b High numbers of YFP-positive cells (effectively labeled by an anti-GFP antibody) were also identified in LMAN (dotted outline). Scale bar 500 μm. c The near perfect fill of HVC is best explained by retrograde transfection from Area X. Scale bar 500 μm. d Retrograde transfection was further confirmed by expression of GFP-positive fibers in RA, which does not receive input from Area X but does receive input from LMAN and HVC. Scale bar 200 μm

Virovek AAV2/5 is effective in transducing Area X neurons, whereas AAV2/9 is not. a Low magnification photomicrograph (left) shows that AAV2/5 can transfect a delimited region of the brain. Some transfection is seen dorsal of the striato-nidopallial border, likely the result of mis-targeting of the injection. Scale bar 500 μm. Higher magnification, right, reveals a high transfection rate. Scale bar 100 μm. b Anti-NeuN antibody signals (red) reveal Area X in left-most panel that is outlined in the middle and right panels. AAV2/9 injection in Area X leads to GFP-positive signals (green, middle panel) in cells that are diffusely scattered around the injection site. Images are merged in the right panel

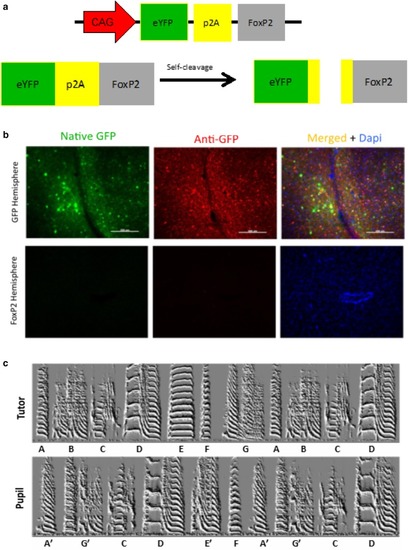
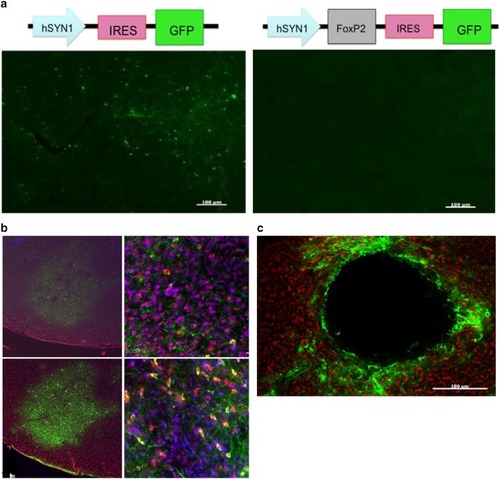
A p2A sequence is ineffective in expressing either GFP or FoxP2. a Schematic of virus that utilizes a p2A. In theory, a single gene product should be translated which creates a GFP-p2A-FoxP2 fusion protein that is then self-cleaved into separate GFP and FoxP2 molecules that each carry residual p2A peptides on their C- and N-termini, respectively. bTop panels the GFP virus-injected hemisphere showed high levels of native GFP (green) which was further enhanced using an anti-GFP antibody (red). Lower panels in contrast no GFP, native or enhanced, was visible in the contralateral hemisphere injected with the GFP-p2A-FoxP2 virus. Blue signals reflect DAPI staining. c Exemplar song spectrograms of an adult male tutor (top) and his adult (>100 days) male son (bottom)

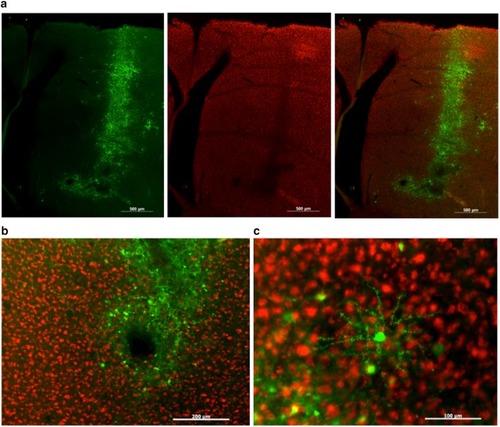
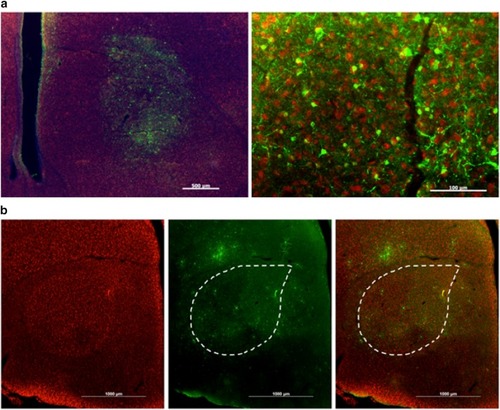
HSV effectively transfects Area X but can cause neurotoxicity. a Photomicrographs show high levels of GFP (green in left and right panels) along the injection track. A NeuN stain (red signals, center and right panel) reveals a darkened area indicative of neurotoxicity. Scale bar 500 μm b The HSV injection produced a relatively small lesion at the injection site. Scale bar 200 μm. c Higher magnification shows transduction of a neuron that morphologically resembles MSNs. Scale bar 100 μm

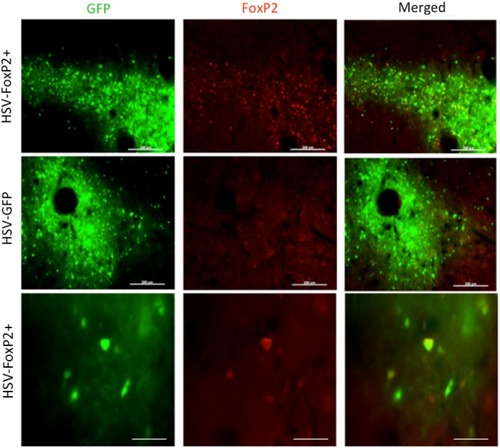
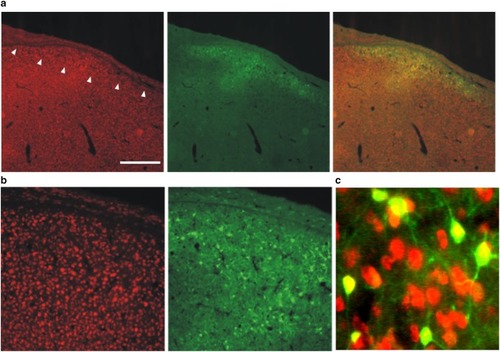
HSV is effective in overexpressing FoxP2. Photomicrographs from a bird that was injected with HSV-FoxP2+ in Area X of one hemisphere (top and bottom rows) and HSV-GFP in the other (middle row). While GFP is observed in both hemispheres, elevated levels of FoxP2 (red signals) are detected only in the HSV-FoxP2+ hemisphere and only in the region showing GFP. The tight correspondence between GFP and FoxP2 signals in the HSV-FoxP+ hemisphere is clear at higher magnification (bottom row). Scale bars 200 μm in top two rows and 50 μm in the bottom row

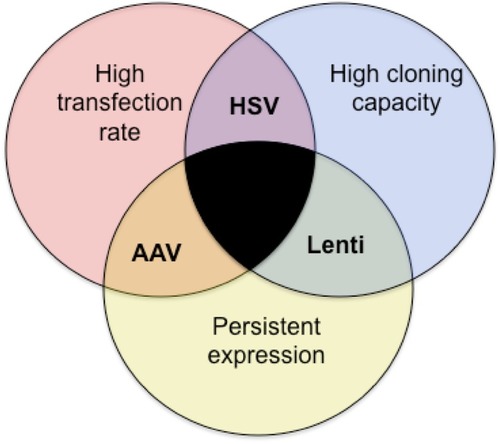
Venn diagram highlights the strengths and limitations of each virus type as they relate to specific requirements necessary for a given scientific application. Those requirements are (1) a high rate of transfection, (2) a high cloning capacity and, (3) persistent expression. Each viral type tested here fulfills only two requirements

Acknowledgments
This image is the copyrighted work of the attributed author or publisher, and ZFIN has permission only to display this image to its users. Additional permissions should be obtained from the applicable author or publisher of the image. Full text @ J. Comp. Physiol. A