
- Title
-
The Midline Axon Crossing Decision Is Regulated through an Activity-Dependent Mechanism by the NMDA Receptor
- Authors
- Gao, J., Stevenson, T.J., Douglass, A.D., Barrios, J.P., Bonkowsky, J.L.
- Source
- Full text @ eNeuro
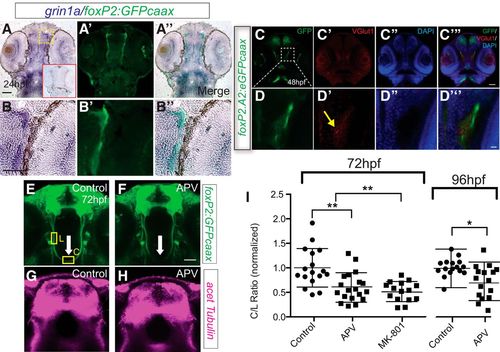
foxP2-enhancerA.2:egfp-caax axons coexpress and are adjacent to a glutamate source (Vglut1 expression). A–B’’, Sections of 24 hpf embryos, α-GFP immunohistochemistry, and grin1a in situ, rostral top; scale bar = 50 µm, 25 μm (B–B’’). Red boxed inset in first panel shows embryo stained with grin1a sense probe. Tg(foxP2-enhancerA.2:egfp-caax) embryo has coexpression of GFP and grin1a in TCPT axons. C–D’’, Confocal whole-mount images of 36-hpf embryos, α-GFP immunohistochemistry, α-Vglut1 immunohistochemistry, and DAPI nuclear stain, rostral top; scale bar = 50 µm, 10 μm (D–D’’). TCPT axons pass adjacent to glutamatergic neurons. E–G, NMDAR blockade reduces midline crossing. E–F, Confocal image of Tg(foxP2-enhancerA.2:egfp-caax) embryos, showing where measurements were made for the intensity of commissural (C) and longitudinal (L) axon tracts (for details, see Materials and Methods). Maximum intensity z-stack projections, α-GFP immunohistochemistry, rostral top; scale bar = 50 µm. TCPTc midline axon crossing is disrupted (arrow) when treated with APV (F) compared to control (E). G, H, Confocal images of the telencephalon show no difference in overall axon projection patterns and densities of APV-treated compared to control embryos. Maximum intensity z-stack projections, α-acetylated tubulin immunohistochemistry, rostral top. I, Scatterplot C/L quantification results performed at 72 or 96 hpf; *p < 0.05; **p < 0.01; ANOVA with post hoc Tukey’s HSD or Student’s t test. Data are in Extended Data Figures 1-1, 1-2. EXPRESSION / LABELING:
PHENOTYPE:
|

ZFIN is incorporating published figure images and captions as part of an ongoing project. Figures from some publications have not yet been curated, or are not available for display because of copyright restrictions. PHENOTYPE:
|
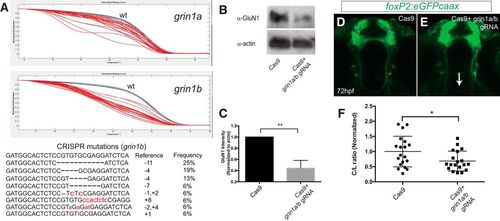
CRISPR knock-down of grin1a/b reduces TCPT crossing. A, top panels, Normalized melt curves of PCR amplicons from individual CRISPR-injected embryos. Red melt curves show significant difference from wt curves; blue melt curves, wt controls; gray melt curves, experimental (injected) not different from wt. Y-axis, normalized fluorescence; x-axis, temperature. Bottom panel, Sequences of clones recovered from PCR amplicons at the grin1b locus following CRISPR mutagenesis. B, C, GluN1 levels (α-NMDAR) are decreased following CRISPR knock-down. Whole-animal Western blotting at 72 hpf and quantification. Triplicate, n > 5 embryos each experiment; **p < 0.01, Student’s t test. Error bars, SEM. D, E, Tg(foxP2-enhancerA.2:egfp-caax) embryos, maximum intensity z-stack projections, α-GFP immunohistochemistry, rostral top; scale bar = 50 µm. TCPTc midline axon crossing is disrupted (arrow) when treated with gRNA (E) compared to control (Cas9 protein alone; D). F, CRISPR quantification, scatterplot C/L results for TCPT crossing; *p < 0.05; Student’s t test. EXPRESSION / LABELING:
PHENOTYPE:
|
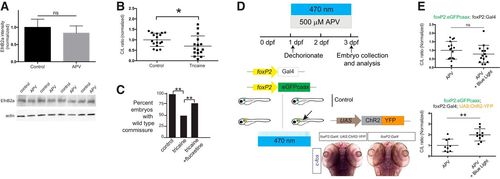
The midline crossing decision is regulated by neuronal activity controlled by the NMDAR. A, EphrinB2a (EfnB2a) levels are unchanged in the telencephalon with APV treatment. Bar graphs show confocal quantification in telencephalon; ns, not significant; Student’s t test. Error bars, SEM. Western blotting of the four separate experiments with actin control is shown below. B, Tricaine quantification, scatterplot C/L results for TCPT crossing; *p < 0.05; Student’s t test. C, Fluoxetine rescues effects of tricaine on TCPTc. Intensity ratio data shown with values normalized to controls as bar graphs; *p < 0.05; Student’s t test; error bars, SEM. D, Schematic workflow of optogenetic analysis. Embryos were dechorionated and exposed to APV and 470-nm light exposure from 1 to 3 dpf. Embryos were double-transgenic for foxP2:egfp-caax; foxP2:Gal4. Some embryos carried UAS:ChR2-YFP (determined by post hoc genotyping). If neuronal activity could rescue pathfinding, only triple-transgenic embryos would have normal midline pathfinding (arrow). Bottom pictures, In situ c-fos analysis of experimental embryos after 470-nm light exposure. Embryos carrying ChR2-YFP have increased c-fos expression (red arrow in region of foxP2.A.2 neurons). E, Results of optogenetic experiment show that specific restoration of activity in foxP2.A.2 neurons is sufficient to rescue APV inhibition. Top plot, Double-transgenic embryos (no channelrhodopsin) have no rescue. Bottom plot, Triple-transgenic embryos restore midline pathfinding. C/L scatterplot results; ns, not significant; **p < 0.01; Student’s t test. EXPRESSION / LABELING:
PHENOTYPE:
|
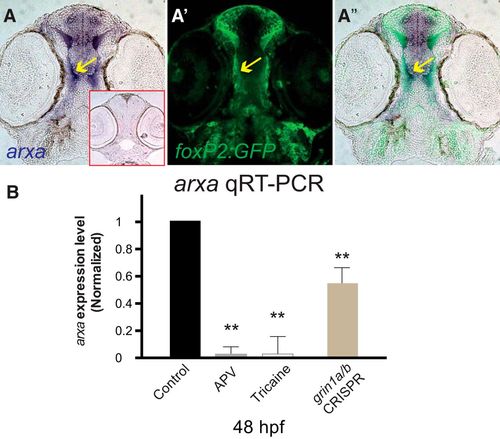
arxa levels are regulated by activity and the NMDAR. A–A’’, foxP2.A.2:egfp-caax and arxa are coexpressed in early development as the TCPT axons extend toward the midline. Sections, rostral top, of arxa in situ expression and Tg(foxP2.A.2:egfp-caax) α-GFP immunohistochemistry. Red boxed inset shows sense probe control for arxa. B, arxa expression is reduced following blockade (APV) or knock-down (CRISPR) of NMDAR or inhibiting activity (tricaine). qRT-PCR at 48 hpf, experimental triplicates; n > 10 embryos each group. Relative log2 fold change calculated relative to wild-type, elf1a standard, SD for each in parenthesis, p values adjusted using Benjamini–Hochberg false discovery rate; **p < 0.01; error bars, SEM. |