
Fig. 1
- ID
- ZDB-IMAGE-180727-19
- Genes
- Antibodies
- Publication
- Gao et al., 2018 - The Midline Axon Crossing Decision Is Regulated through an Activity-Dependent Mechanism by the NMDA Receptor
- All Figures
- Figures for Gao et al., 2018
|
Fig. 1
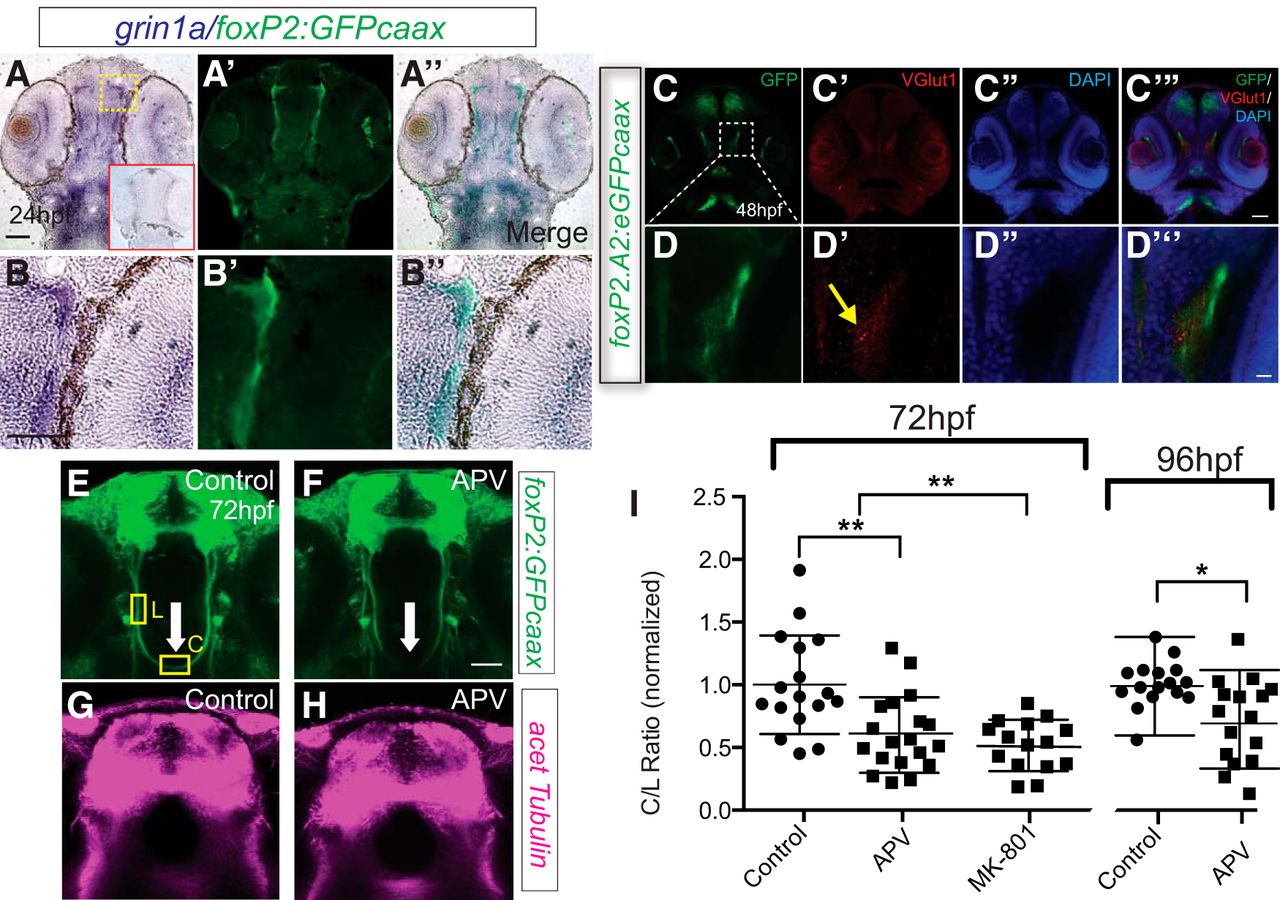
foxP2-enhancerA.2:egfp-caax axons coexpress and are adjacent to a glutamate source (Vglut1 expression). A–B’’, Sections of 24 hpf embryos, α-GFP immunohistochemistry, and grin1a in situ, rostral top; scale bar = 50 µm, 25 μm (B–B’’). Red boxed inset in first panel shows embryo stained with grin1a sense probe. Tg(foxP2-enhancerA.2:egfp-caax) embryo has coexpression of GFP and grin1a in TCPT axons. C–D’’, Confocal whole-mount images of 36-hpf embryos, α-GFP immunohistochemistry, α-Vglut1 immunohistochemistry, and DAPI nuclear stain, rostral top; scale bar = 50 µm, 10 μm (D–D’’). TCPT axons pass adjacent to glutamatergic neurons. E–G, NMDAR blockade reduces midline crossing. E–F, Confocal image of Tg(foxP2-enhancerA.2:egfp-caax) embryos, showing where measurements were made for the intensity of commissural (C) and longitudinal (L) axon tracts (for details, see Materials and Methods). Maximum intensity z-stack projections, α-GFP immunohistochemistry, rostral top; scale bar = 50 µm. TCPTc midline axon crossing is disrupted (arrow) when treated with APV (F) compared to control (E). G, H, Confocal images of the telencephalon show no difference in overall axon projection patterns and densities of APV-treated compared to control embryos. Maximum intensity z-stack projections, α-acetylated tubulin immunohistochemistry, rostral top. I, Scatterplot C/L quantification results performed at 72 or 96 hpf; *p < 0.05; **p < 0.01; ANOVA with post hoc Tukey’s HSD or Student’s t test. Data are in Extended Data Figures 1-1, 1-2.