
Fig. 3
- ID
- ZDB-IMAGE-180727-20
- Genes
- Antibodies
- Publication
- Gao et al., 2018 - The Midline Axon Crossing Decision Is Regulated through an Activity-Dependent Mechanism by the NMDA Receptor
- All Figures
- Figures for Gao et al., 2018
|
Fig. 3
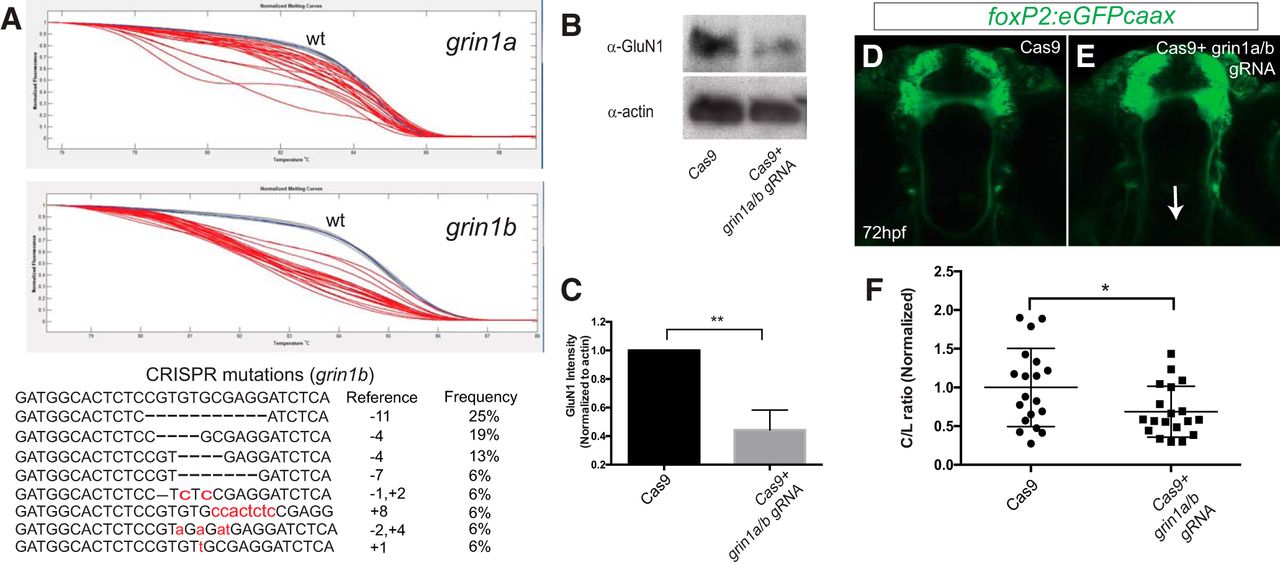
CRISPR knock-down of grin1a/b reduces TCPT crossing. A, top panels, Normalized melt curves of PCR amplicons from individual CRISPR-injected embryos. Red melt curves show significant difference from wt curves; blue melt curves, wt controls; gray melt curves, experimental (injected) not different from wt. Y-axis, normalized fluorescence; x-axis, temperature. Bottom panel, Sequences of clones recovered from PCR amplicons at the grin1b locus following CRISPR mutagenesis. B, C, GluN1 levels (α-NMDAR) are decreased following CRISPR knock-down. Whole-animal Western blotting at 72 hpf and quantification. Triplicate, n > 5 embryos each experiment; **p < 0.01, Student’s t test. Error bars, SEM. D, E, Tg(foxP2-enhancerA.2:egfp-caax) embryos, maximum intensity z-stack projections, α-GFP immunohistochemistry, rostral top; scale bar = 50 µm. TCPTc midline axon crossing is disrupted (arrow) when treated with gRNA (E) compared to control (Cas9 protein alone; D). F, CRISPR quantification, scatterplot C/L results for TCPT crossing; *p < 0.05; Student’s t test.