
- Title
-
Overexpression of DYRK1A, a Down Syndrome Candidate gene, Impairs Primordial Germ Cells Maintenance and Migration in zebrafish
- Authors
- Liu, Y., Lin, Z., Liu, M., Wang, H., Sun, H.
- Source
- Full text @ Sci. Rep.
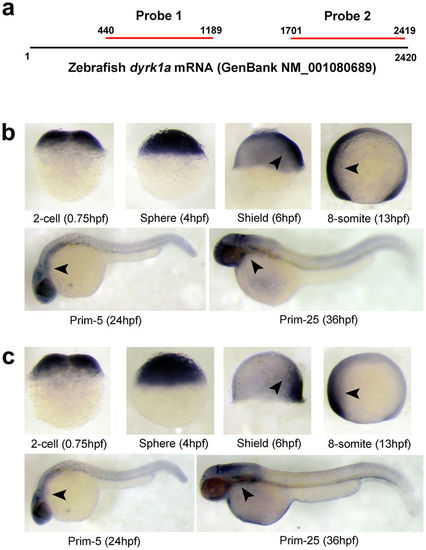
Spatiotemporal expression pattern of DYRK1A transcript in zebrafish embryos. (a) Location of anti-sense RNA probe for detection of zebrafish DYRK1A using WISH. (b) Detection by Probe 1 at indicated stages. (c) Detection by Probe 2 at indicated stages. Arrows show the stronger expression region of DYRK1A. The same expression pattern of DYRK1A shown by two non-overlapping probes, demonstrating the specificity and identical spatially restricted expression patterns of DYRK1A in zebrafish early embryogenesis. Embryo orientations: 2-cell and Sphere stage, lateral views with the animal pole oriented at the top; Shield stage, lateral view with the dorsal side oriented at the right; 8-somite, Prim-5 and Prim-25 stage, lateral views with anterior oriented toward the left. |
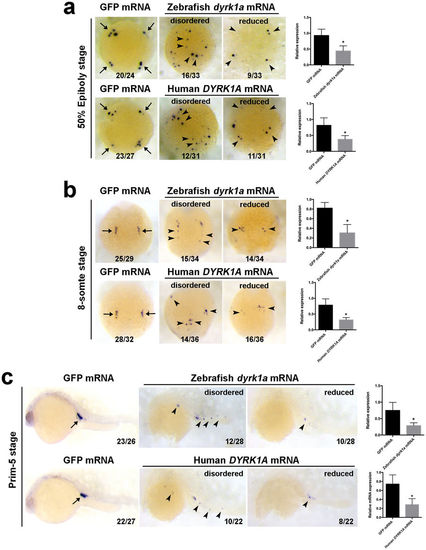
Overexpression of DYRK1A induces nanos1-marked PGCs deficiency in early zebrafish embryo. Analysis of localization and strength of nanos1 positive cells in DYRK1A overexpressed embryos by WISH at 50% Epiboly stage (a), 8-somite stage (b) and Prim-5 stage (c). Histogram representing the relative expression detected by qPCR in GFP injected and DYRK1A overexpressed embryos at corresponding assay. Embryo orientations: 50% Epiboly stage, top view with the dorsal oriented at the right; 8-somite, dorsal view with anterior oriented at the top; Prim-5 stage, lateral views with anterior oriented toward the left. Arrows show the normal location of PGCs, arrowheads demonstrate the aberrant position of PGCs induced by overexpressed DYRK1A. The numbers indicated in each picture are the number (left) of affected embryos with phenotype similar to what is shown in the picture and the total number (right) of observed embryos. The same number labeling was used thereafter. |

Overexpression of DYRK1A induces vasa-marked PGCs deficiency in early zebrafish embryo. Analysis of localization and strength of vasa positive cells in DYRK1A overexpressed embryos by WISH at 50% Epiboly stage (a), 8-somite stage (b) and Prim-5 stage (c). Histogram representing the relative expression detected by qPCR in GFP injected and DYRK1A overexpressed embryos at corresponding assay. Embryo orientations: 50% Epiboly stage, top view with the dorsal oriented at the right; 8-somite, dorsal view with anterior oriented at the top; Prim-5 stage, lateral views with anterior oriented toward the left. Arrows show the normal location of PGCs, arrowheads demonstrate the aberrant position of PGCs induced by overexpressed DYRK1A. |
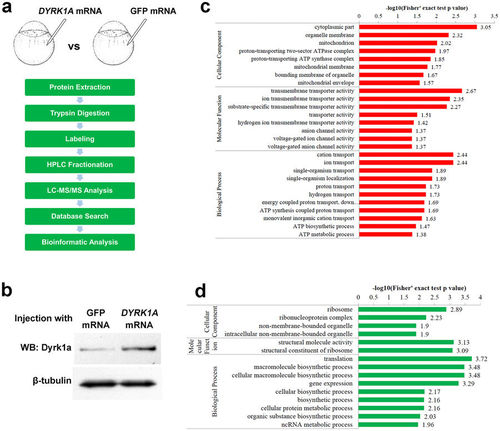
Proteomics analysis shows the altered proteins pattern essential for PGCs development in DYRK1A overexpressed embryos. (a) General work flow of Proteomics analysis in this work. (b) Embryos injected with DYRK1A mRNA show increased protein level of DYRK1A. The blots shown are cropped; the uncropped full-length gels are presented in the Supplementary Figure 1. Gene Ontology (GO)-based enrichment analysis of up-regulated (c) and down-regulated (d) proteins (DYRK1A mRNA vs GFP mRNA). |
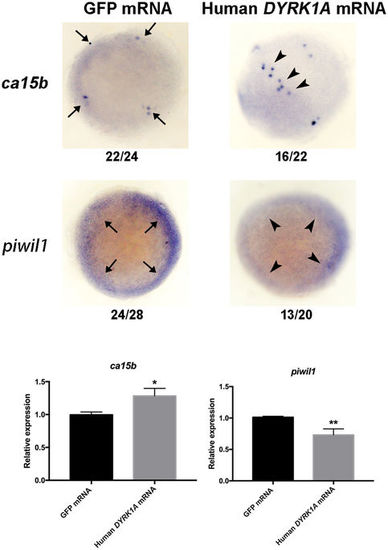
Verification of aberrant expression of PGCs key factors in DYRK1A overexpressed embryos. Analysis of localization and strength of ca15b and piwil1 in DYRK1A overexpressed embryos by WISH. All of embryos are 50%-epiboly stage with top view. Arrows show the normal location of detected gene, arrowheads demonstrate the aberrant position induced by overexpressed DYRK1A. Histogram representing the relative expression of ca15b and piwil1 in GFP injected and DYRK1A overexpressed embryos detected by qPCR. |
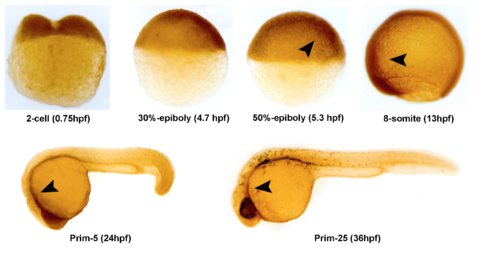
Spatiotemporal expression pattern of Dyrk1a protein in zebrafish embryos. Detection of zebrafish Dyrk1a protein using whole-mount immunohistochemistry (WIHC) at indicated stages. Arrows show the stronger expression region of Dyrk1a protein. It is shown that expression pattern of Dyrk1a protein is similar to dyrk1a transcripts detected by WISH. Embryo orientations: 2-cell, 30%-epiboly and 50%-epiboly stage, lateral views with the animal pole oriented at the top; 8-somite, Prim-5 and Prim-25 stage, lateral views with anterior oriented toward the left. |
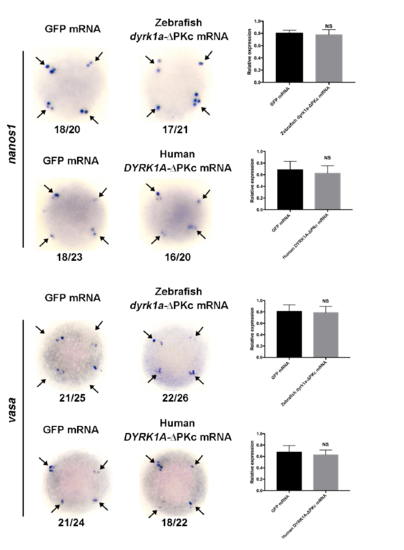
PKc conserved domain deletion mutant of DYRK1A fails to induce abnormality of PGCs development. Analysis of localization and strength of nanos1 and vasa by WISH. All of embryos are 50%-epiboly stage with top view. Arrows show the normal location of detected gene. Histogram representing the relative expression of nanos1 and vasa detected by qPCR. |
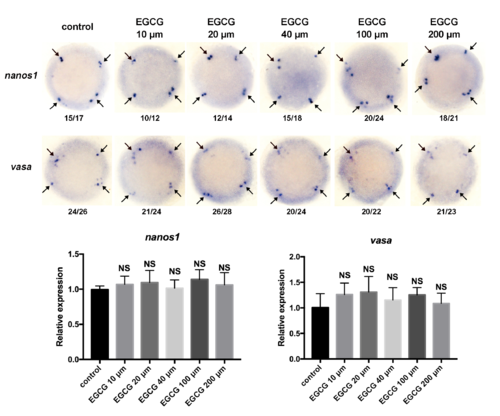
Dyrk1a inhibitor EGCG can not lead to aberration of PGCs development. Analysis of localization and strength of nanos1 and vasa by WISH. All of embryos are 50%-epiboly stage with top view. Arrows show the normal location of detected gene. Histogram representing the relative expression of nanos1 and vasa detected by qPCR. |