
|
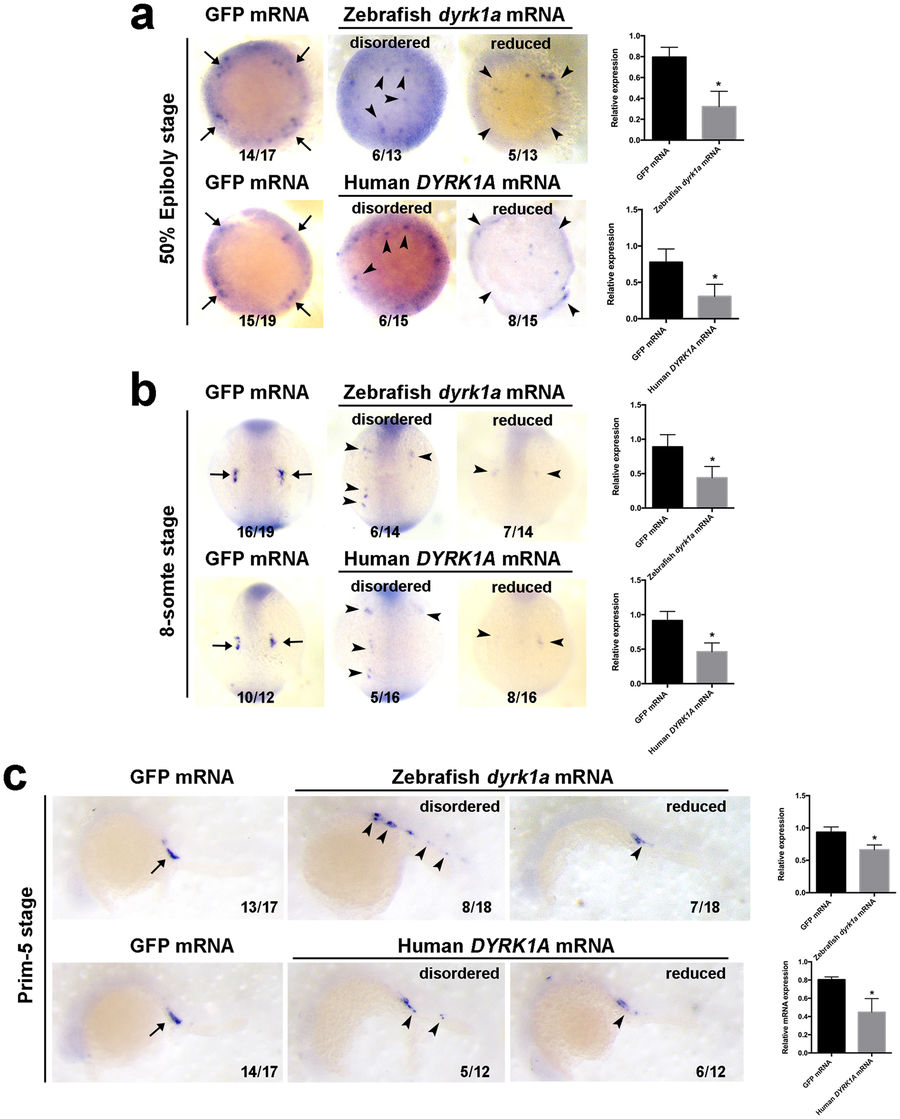
Fig. 4
Overexpression of DYRK1A induces vasa-marked PGCs deficiency in early zebrafish embryo. Analysis of localization and strength of vasa positive cells in DYRK1A overexpressed embryos by WISH at 50% Epiboly stage (a), 8-somite stage (b) and Prim-5 stage (c). Histogram representing the relative expression detected by qPCR in GFP injected and DYRK1A overexpressed embryos at corresponding assay. Embryo orientations: 50% Epiboly stage, top view with the dorsal oriented at the right; 8-somite, dorsal view with anterior oriented at the top; Prim-5 stage, lateral views with anterior oriented toward the left. Arrows show the normal location of PGCs, arrowheads demonstrate the aberrant position of PGCs induced by overexpressed DYRK1A.