
Image
|
Figure Caption
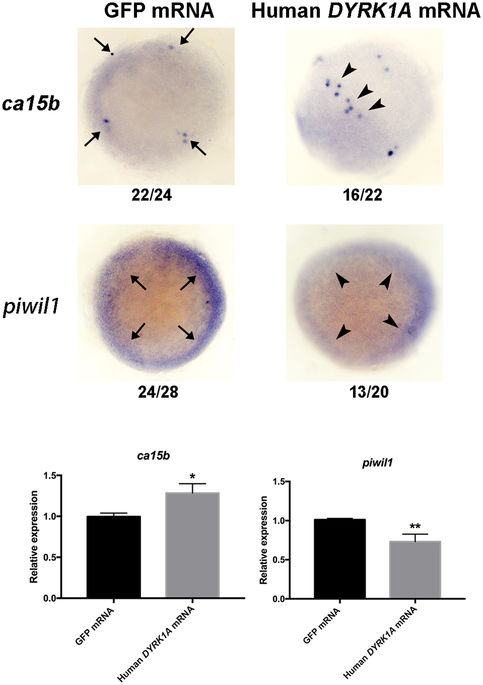
Fig. 6
Verification of aberrant expression of PGCs key factors in DYRK1A overexpressed embryos. Analysis of localization and strength of ca15b and piwil1 in DYRK1A overexpressed embryos by WISH. All of embryos are 50%-epiboly stage with top view. Arrows show the normal location of detected gene, arrowheads demonstrate the aberrant position induced by overexpressed DYRK1A. Histogram representing the relative expression of ca15b and piwil1 in GFP injected and DYRK1A overexpressed embryos detected by qPCR.
Acknowledgments
This image is the copyrighted work of the attributed author or publisher, and
ZFIN has permission only to display this image to its users.
Additional permissions should be obtained from the applicable author or publisher of the image.
Full text @ Sci. Rep.