
- Title
-
Endodermal germ-layer formation through active actin-driven migration triggered by N-cadherin
- Authors
- Giger, F.A., David, N.B.
- Source
- Full text @ Proc. Natl. Acad. Sci. USA
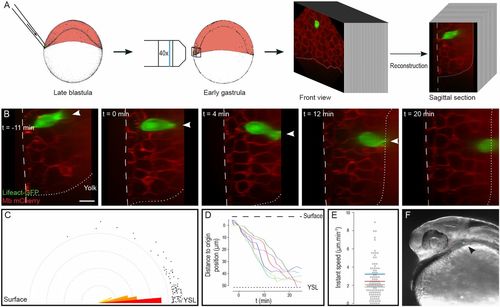
Endodermal cells rapidly migrate to the YSL. (A) Lifeact-GFP–expressing endodermal cells were transplanted to the margin of embryos expressing membrane-bound mCherry, just beneath the EVL. 4D stacks were acquired, and sagittal sections were reconstructed. (B) Sagittal sections showing endodermal cell internalization (Movie S1). Arrowheads point to actin-rich cytoplasmic extensions. The dashed line delineates the surface of the embryo; the dotted line represents the limit between the blastoderm and the YSL. Animal pole is to the top. (C) Orientation of actin-rich protrusions. Dots represent measurements. (D) Movement of internalizing cells along the surface–YSL axis. The spatial and temporal origin is defined as the beginning of migration. (E) Instant speed of internalizing cells along the surface–YSL axis. Mean speed for each cell is represented as a colored segment. (F) Transplanted endodermal cells contribute to endodermal derivatives at 24 hpf (arrowhead). (Scale bar: 20 µm.) |

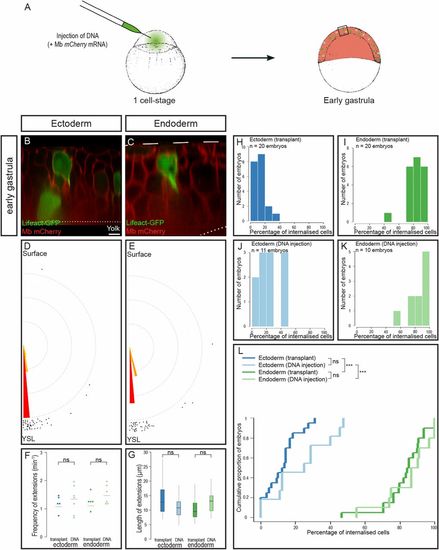
Active migration is sufficient to ensure endoderm internalization. (A–F) Ectodermal cells (A and D) or endodermal cells (B, C, E, and F) were transplanted to the superficial-most layer of a blastoderm of either ectodermal (A, B, D, and E) or endodermal (C and F) identity. Sections show the position of transplanted cells at the onset of gastrulation (A–C) and at midgastrulation (D–F). (G) Distribution of embryos according to the percentage of internalized cells at midgastrulation plotted as a cumulative plot. ***P < 0.001. (H–K) Endodermal cells (red nuclear labeling) were transplanted into ectodermal (H and J) or endodermal (I and K) neighboring cells. (H and I) Expression of the endodermal marker sox32 revealed by in situ hybridization. (J and K) E-cadherin immunohistochemistry revealed similar protein levels at the interface between two transplanted cells (red nuclear labeling) and between two host neighboring cells (ntransplanted endo > ecto = 11, necto = 13, Ptransplanted endo/ecto = 0.83, ntransplanted endo > endo = 10, nendo = 10, Ptransplanted endo/endo = 0.69). (Scale bars: 20 µm.) |
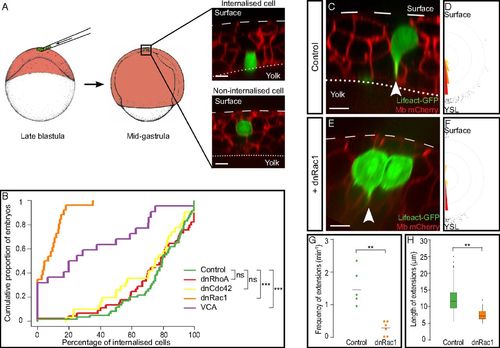
Rac1 and Arp2/3 are required for the internalization of endodermal cells. (A) Endodermal cells were transplanted into the superficial-most layer of the blastoderm. By midgastrulation, cells in contact with the surface of the YSL were counted as internalized, and cells in contact with the EVL were counted as noninternalized. (B) Distribution of embryos according to the percentage of internalized cells at midgastrulation plotted as a cumulative plot. While most control, dnRhoA-, and dnCdc42-expressing endodermal cells were internalized, endodermal cells expressing either dnRac1 or VCA were not. (C and E) Cytoplasmic extensions (arrowheads) emitted by control (C) or dnRac1-expressing (E) endodermal cells labeled with Lifeact-GFP. (D and F) Orientation of cytoplasmic extensions emitted by control (D) or dnRac1-expressing (F) endodermal cells. (G and H) Frequency (G) and length (H) of cytoplasmic extensions emitted by control or dnRac1-expressing endodermal cells. (Scale bars: 10 µm.) ns, nonsignificant (P > 0.05); **P < 0.01; ***P < 0.001. |

Endodermal cells are not attracted to the YSL. (A) Ectodermal or endodermal cells were transplanted to the animal pole of a host embryo. An animal cap explant was then dissected and cultured. (B and C) After 3 h of culture, transplanted ectodermal cells are still in the cap explant (B), while endodermal cells have exited (C). (B and C, Upper) Top view. (B and C, Lower) Section along the dotted line in the upper view; brackets show the position of the animal cap. (D) Endodermal cells migrate out of the explant (Movie S11) using actin-rich protrusions pointing outwards (arrowheads). (Scale bars: 10 µm.) |
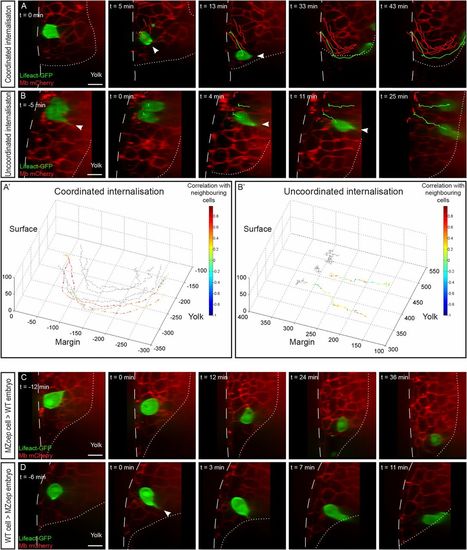
Cell-autonomous and non–cell-autonomous effects in endoderm internalization. (A and B) Internalization of endodermal cells expressing Lifeact-GFP transplanted to the margin of a wild-type host embryo expressing membrane-bound mCherry. Arrowheads point to cytoplasmic extensions. Sagittal view, animal pole is to the top. (A′ and B′) Tracks of the movement of transplanted cells (colored arrows) and neighboring cells (gray arrows). The length of the arrows represents the instant speed. The color code represents the correlation of the instant displacement of the transplanted endodermal cell with the mean instant displacement of four neighboring cells. (A and A′) Coordinated internalization movement (Movie S3). (B and B′) Uncoordinated internalization movement (Movie S4). (C) When transplanted into a wild-type host, noninternalizing (MZoep) cells are driven into the hypoblast by their neighbors (Movie S5). (D) When transplanted into a nongastrulating (MZoep) host embryo, wild-type endodermal cells internalize autonomously, using actin-rich protrusions and rapid migration (Movie S6). (Scale bars: 10 µm.) |
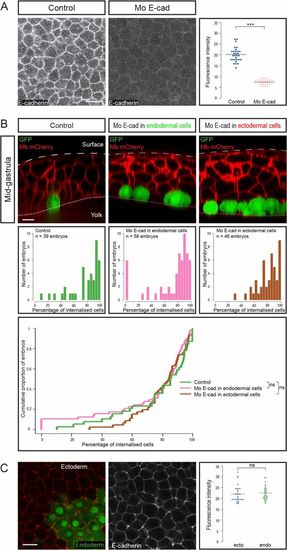
Endodermal cell internalization is independent of E-cadherin levels. (A) E-cadherin expression, assessed by immunohistochemistry, was reduced upon morpholino injection (animal views). Images were all acquired in the same conditions. (Scale bar: 20 µm.) Fluorescence intensity was quantified at cell boundaries (n = 6 embryos for each condition). ***P < 0.001. (B) To assess the importance of E-cadherin adhesion in internalization, endodermal cells were transplanted to the animal pole, E-cadherin being down-regulated either in transplanted endodermal cells or in their ectodermal neighbors. (Top) Sagittal sections showing the position of transplanted cells at midgastrulation. (Scale bar: 10 µm.) (Middle and Bottom) Distribution of embryos according to the percentage of internalized cells at midgastrulation plotted as histograms (Middle) or as a cumulative plot (Bottom). (C) E-cadherin expression assessed by immunohistochemistry in induced endodermal cells (expressing GFP) and ectodermal cells (animal view). Fluorescence intensity was quantified at boundaries between ectodermal cells and between endodermal cells (n = 5 embryos, P = 0.6). (Scale bar: 20 µm.) ns, nonsignificant (P > 0.05). |
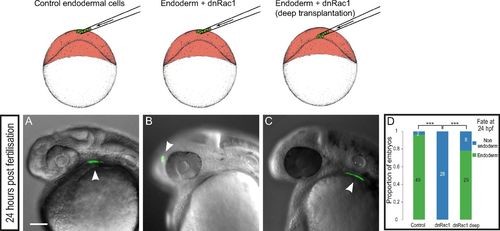
Rac1 inhibition specifically impairs endoderm internalization. Control endodermal cells were transplanted just beneath the EVL (A), and dnRac1-expressing endodermal cells were transplanted just beneath the EVL (B) or close to the YSL (C). At 24 hpf, while control cells contribute to endodermal derivatives (A), endodermal cells expressing dnRac1 transplanted just beneath the EVL are found in ectodermal derivatives (B). (C) Importantly, dnRac1-expressing cells transplanted close to the YSL contribute to endodermal derivatives at 24 hpf. (D) Distribution of embryos with transplanted cells in endodermal derivatives at 24 hpf. ***P < 0.001. (Scale bar: 100 μm.) |

Ectodermal cells are protrusive and polarized. (A) Position of cell transplantation just beneath the EVL, at the animal pole of the embryo. (B–E) Ectodermal cells expressing Lifeact-GFP emit large cytoplasmic extensions (arrowhead in B) oriented toward the YSL (C), of the same length (D) and at the same frequency (E) as endodermal cells. nendo = 72 extensions, necto = 71 extensions, Pangle endo/ecto = 0.97. (Scale bar: 10 µm.) ns, nonsignificant (P > 0.05). |
Creation of mosaic embryos by plasmid DNA injection. (A) Injection of plasmid DNA at the one-cell stage leads to mosaic expression. (B–G) Optical sections of mosaic embryos created by plasmid DNA injection of either Lifeact-GFP (B and D) or Tar*:HSE:Lifeact-GFP (C and E). Cells emit large cytoplasmic extensions (B and C) oriented toward the YSL (D and E) at the same frequency (F) and of the same length (G) as with cell transplantation. necto transplant = 71 extensions, necto DNA = 54 extensions, Pangle ecto transplant/DNA = 0.55; nendo transplant = 72 extensions, nendo DNA = 46 extensions, Pangle endo transplant/DNA = 0.46. ns, nonsignificant (P > 0.05). (H–L) Distribution of embryos according to the percentage of internalized cells at midgastrulation plotted as histograms (H–K) or as a cumulative plot (L). ***P < 0.001. (Scale bar: 10 μm.) |
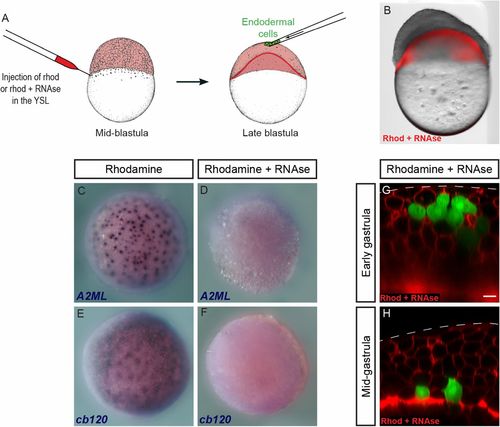
Endodermal cells internalize in the absence of YSL translation. (A) Rhodamine-dextran, alone or in combination with RNase, was injected into the YSL of embryos at the midblastula stage. Endodermal cells were then transplanted into the animal pole at the late blastula stage. (B) RNase injection induces strong developmental defects. Image on B was acquired on a stereo microscope. Two separate images (brightfield and red fluorescence) were acquired and overlaid in Photoshop. (C–F) In situ hybridization for YSL transcripts A2ML (C and D) and cb120 (E and F) in control (C and E) and RNase-injected (D and F) embryos. (G and H) Endodermal cells transplanted to the animal pole of RNase-injected embryos (G) were internalized by midgastrulation (H). (Scale bar: 10 μm.) EXPRESSION / LABELING:
|
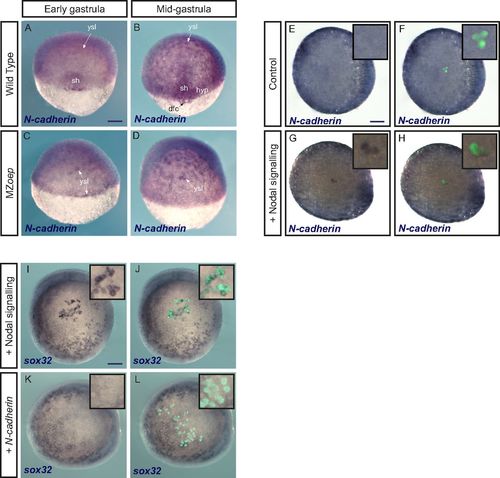
N-cadherin is expressed downstream of Nodal but does not induce an endodermal fate. (A–D) N-cadherin expression detected by in situ hybridization is lost in the shield and hypoblast in mutants lacking Nodal signaling (MZoep mutants). dfc, dorsal forerunner cells; hyp, hypoblast; sh, shield. (E–H) Conversely, N-cadherin expression is induced by Nodal signaling. Control ectodermal cells (E and F) or cells expressing the constitutively active Nodal receptor (G and H) were transplanted to the animal pole of a host embryo. N-cadherin expression was revealed by in situ hybridization. E–H show the same embryos in brightfield alone (E and G) or with the green signal from transplanted cells (F and H). Insets are close-ups of the animal pole region bearing transplanted cells (magnification, 3×). (I–L) Contrary to activation of Nodal signaling (I and J), which was used as a control, overexpression of N-cadherin (K and L) does not induce an endodermal fate (in situ hybridization for sox32) in cells transplanted to the animal pole. I–L show the same embryos in brightfield alone (I and K) or with the green signal from transplanted cells (J and L). Insets are close-ups of the animal pole region bearing transplanted cells (magnification, 3×). (Scale bars: 100 μm.) EXPRESSION / LABELING:
|