
|
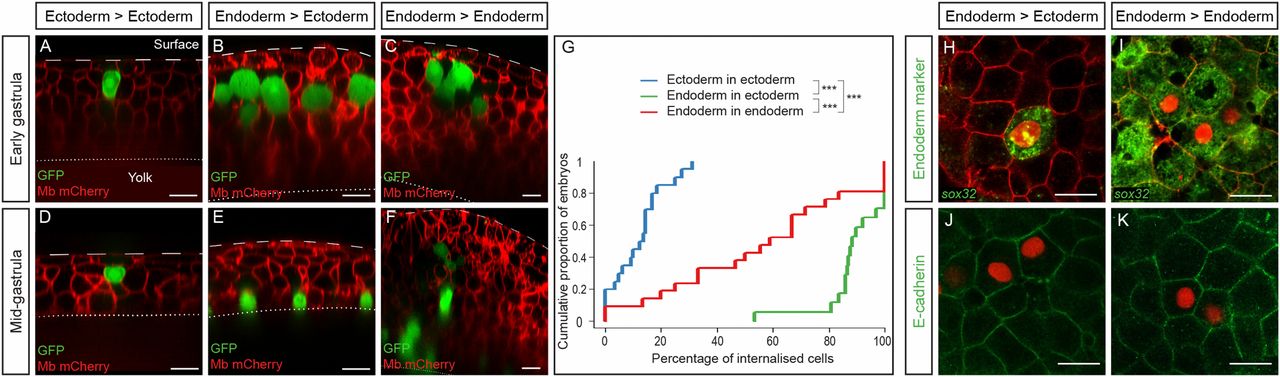
Fig. 2
Active migration is sufficient to ensure endoderm internalization. (A–F) Ectodermal cells (A and D) or endodermal cells (B, C, E, and F) were transplanted to the superficial-most layer of a blastoderm of either ectodermal (A, B, D, and E) or endodermal (C and F) identity. Sections show the position of transplanted cells at the onset of gastrulation (A–C) and at midgastrulation (D–F). (G) Distribution of embryos according to the percentage of internalized cells at midgastrulation plotted as a cumulative plot. ***P < 0.001. (H–K) Endodermal cells (red nuclear labeling) were transplanted into ectodermal (H and J) or endodermal (I and K) neighboring cells. (H and I) Expression of the endodermal marker sox32 revealed by in situ hybridization. (J and K) E-cadherin immunohistochemistry revealed similar protein levels at the interface between two transplanted cells (red nuclear labeling) and between two host neighboring cells (ntransplanted endo > ecto = 11, necto = 13, Ptransplanted endo/ecto = 0.83, ntransplanted endo > endo = 10, nendo = 10, Ptransplanted endo/endo = 0.69). (Scale bars: 20 µm.)