
|
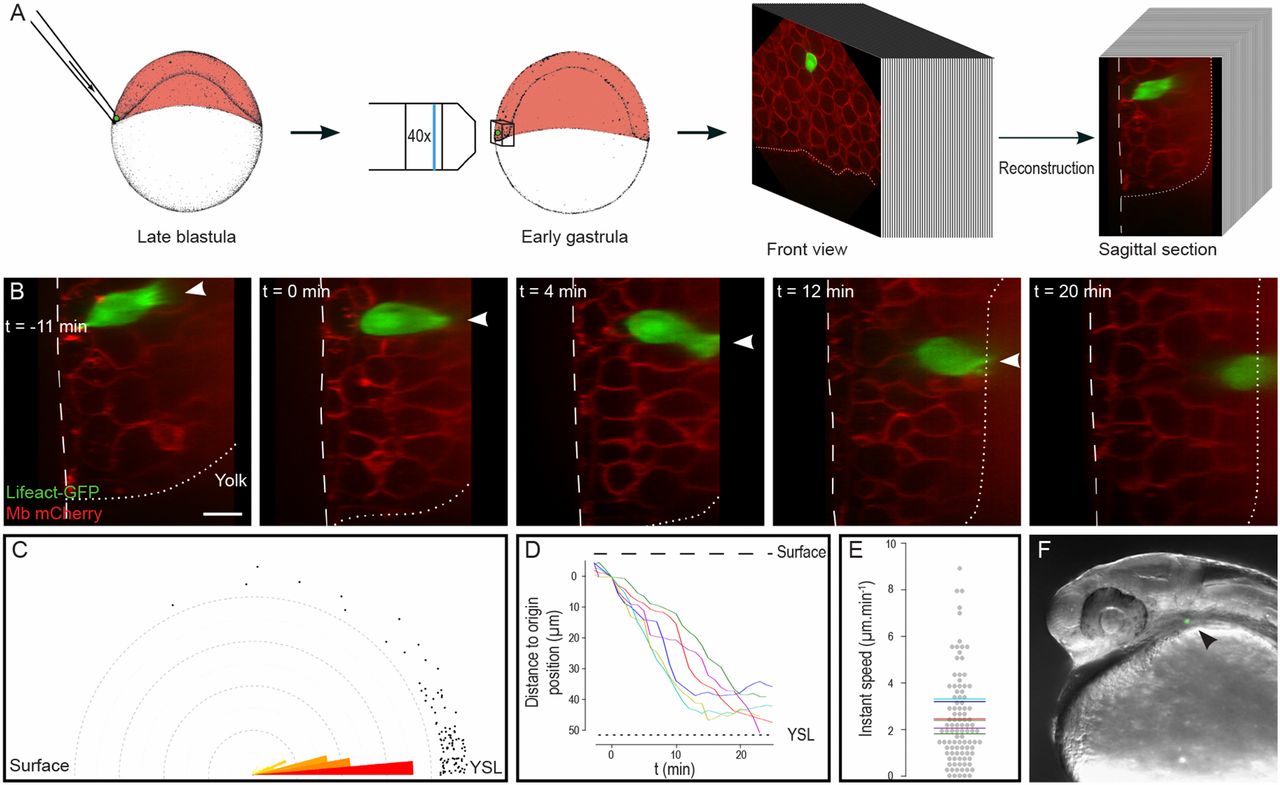
Fig. 1
Endodermal cells rapidly migrate to the YSL. (A) Lifeact-GFP–expressing endodermal cells were transplanted to the margin of embryos expressing membrane-bound mCherry, just beneath the EVL. 4D stacks were acquired, and sagittal sections were reconstructed. (B) Sagittal sections showing endodermal cell internalization (Movie S1). Arrowheads point to actin-rich cytoplasmic extensions. The dashed line delineates the surface of the embryo; the dotted line represents the limit between the blastoderm and the YSL. Animal pole is to the top. (C) Orientation of actin-rich protrusions. Dots represent measurements. (D) Movement of internalizing cells along the surface–YSL axis. The spatial and temporal origin is defined as the beginning of migration. (E) Instant speed of internalizing cells along the surface–YSL axis. Mean speed for each cell is represented as a colored segment. (F) Transplanted endodermal cells contribute to endodermal derivatives at 24 hpf (arrowhead). (Scale bar: 20 µm.)