
- Title
-
Metformin Inhibits Cyst Formation in a Zebrafish Model of Polycystin-2 Deficiency
- Authors
- Chang, M.Y., Ma, T.L., Hung, C.C., Tian, Y.C., Chen, Y.C., Yang, C.W., Cheng, Y.C.
- Source
- Full text @ Sci. Rep.
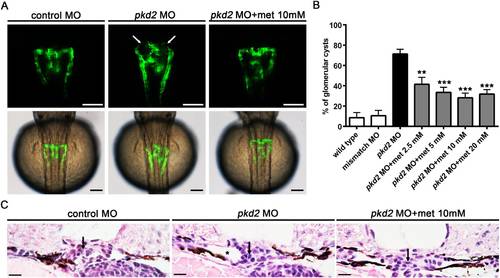
Metformin inhibits pronephric cyst formation in pkd2 morphants. Tg(wt1b:GFP) pkd2 morphants were immersed in embryo media (E3) supplemented with 2.5, 5, 10, or 20 mM metformin until 48 hpf. (A) Representative images of the pronephros in the control embryos, pkd2 morphants, and metformin-treated pkd2 morphants are shown. Note the pronephric cysts (arrows) in the Tg(wt1b:GFP) pkd2 morphant. Photographs from in vivo observation through fluorescence microscopy (dorsal view, anterior to the top) were recorded at 48 hpf. The lower panels show overlays of transmission (grey) and fluorescence (green) images of the upper panels. Scale bar, 100 µm. (B) Comparative frequencies of the cystic phenotype in the control embryos and pkd2 morphants treated with different concentrations of metformin as indicated (n = 45–99 per group). Data represent five independent experiments. **P < 0.01, ***P < 0.001 compared with pkd2 knockdown. (C) Transverse histological sections of the embryos at 48 hpf, illustrating the pronephric cyst (indicated by the mark *) in a pkd2 morphant and the rescue effect of metformin treatment. Arrows indicate the position of glomeruli. H&E stain, scale bar, 10 µm. |
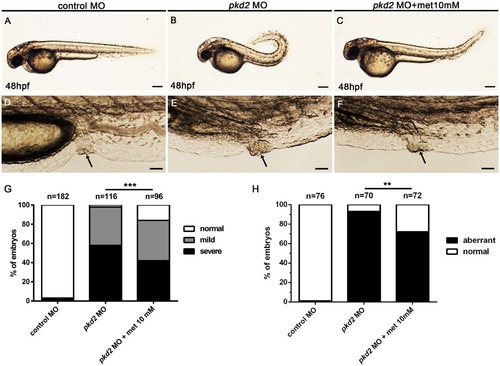
Metformin ameliorates dorsal axis curvature and cloaca malformation in pkd2 morphants. Zebrafish embryos were treated with metformin (10 mM) in supplemented E3 media. (A–C) Representative images showing the common body axis of a control embryo, the severe dorsal curvature of a pkd2 morphant, and the mild dorsal curvature of a metformin-treated pkd2 morphant. Scale bar, 200 µm. (D–F) Representative images showing the cloaca of a control embryo, the cloaca malformation of a pkd2 morphant, and the normal cloaca of a metformin-treated pkd2 morphant. Scale bar, 50 µm. (G) Comparative frequencies of the dorsal curvature phenotype in each group (n = 182, 116, and 96 per group). Data represent four independent experiments. ***P < 0.001 compared with pkd2 morphants. (H) Comparative frequencies of the aberrant cloaca phenotype in each group (n = 76, 70, and 72 per group). Data represent three independent experiments. **P < 0.01 compared with pkd2 morphants. PHENOTYPE:
|

Metformin suppresses pronephric epithelial proliferation in pkd2 morphants. (A) Representative confocal immunofluorescence images showing proliferative cells (arrows) in pkd2 morphants with and without metformin (10 mM) treatment. Embryos were stained using anti-PH3 (red) to mark proliferating cells and anti-α6 F (green) to label the pronephric ducts at 48 hpf. (B) Counts of anti-PH3- and anti-α6F-positive cells in the anterior and posterior pronephric ducts (n = 14–17 per group). *P < 0.05, ***P < 0.001. Data represent two independent experiments. Scale bar, 20 µm. |

Metformin reduces leukocyte infiltration in pkd2 morphants. (A) Representative images of l-plastin-positive and mpx-positive cells surrounding the pronephric ducts in a control MO-injected embryo, a pkd2 morphant, and a pkd2 morphant treated with metformin (10 mM). Leukocytes were labelled using in situ hybridisation for l-plastin and mpx at 48 hpf. The lower panel shows an enlarged view of the dashed box indicated in the upper image. Scale bar, 200 µm. (B) Counts of the l-plastin-positive cells (within the region of yolk extension as indicated by the dashed box) in the controls and metformin-treated pkd2 morphants (2.5 mM to 20 mM). ***P < 0.001 compared with pkd2 morphants. Data represent two independent experiments, n = 7–11 per group. (C) Counts of the mpx-positive cells. **P < 0.01, ***P < 0.001 compared with pkd2 morphants. n.s. = not significant. Data represent two independent experiments, n = 16–20 per group. |
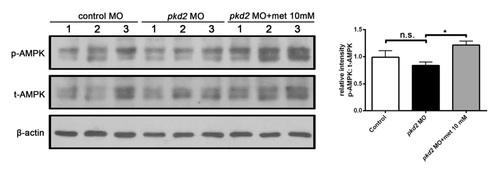
Metformin increases AMPK levels in pkd2 morphants. (A) Representative Western blots for phospho-Thr172 AMPK, total AMPK, and β-actin in total embryo lysates from mismatch MO-injected controls and pkd2 morphants with and without metformin (10 mM) treatment at 48 hpf. (B) Quantification of p-AMPK relative to total AMPK through densitometric analysis of Western blots; n = 9 from five independent experiments. *P < 0.05, n.s. = not significant. Cropped blot images are shown, and all the blots were run under the same experimental conditions. Uncropped blots are shown in Supplementary Fig. S2. |
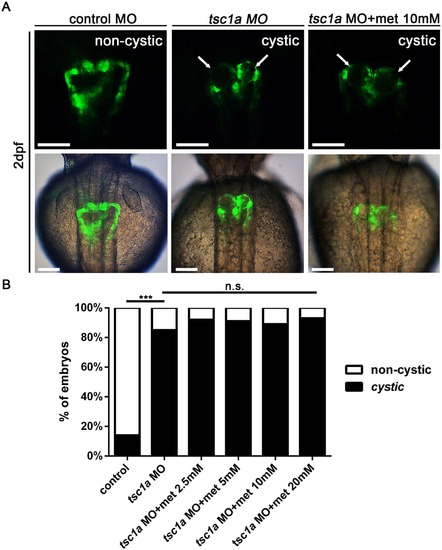
Metformin cannot rescue the cystic phenotype in tsc1a morphants. Tg(wt1b:GFP) tsc1a morphants were immersed in embryo media (E3) containing 2.5 to 20 mM metformin until 48 hpf. (A) Representative images indicating prominent cystic pronephros (arrows) in Tg(wt1b:GFP) tsc1a morphants. Metformin does not affect the formation and severity of pronephric cysts. The upper panels show fluorescence images (dorsal view, anterior to the top). The lower panels show overlays of fluorescence (green) and transmission (grey) images of the upper panels. Scale bar, 100 µm. (B) Comparison of the cystic phenotype in different treatment groups. Data represent two independent experiments (n = 28–46 per group). ***P < 0.001, n.s. = not significant. |

Metformin enhances autophagy in Tg(wt1b:GFP) pkd2 morphants. (A) Representative confocal images of pronephric ducts (green, wt1b:GFP) in control MO-injected embryos, pkd2 morphants, and pkd2 morphants treated with metformin (10 mM) at 48 hpf (n = 4 per group). Transverse cryosections were stained for LC3 (red), and the nuclei were counterstained with DAPI (blue). Note the reduced expression of LC3 (orange dots, red and green merged) in the pkd2 morphant and the rescue effect of metformin treatment. The dotted circle indicates the pronephric duct. Scale bar, 10 µm. (B) Quantification of the expression of LC3-II relative to LC3-I through Western blot analysis of total embryo lysates. ß-actin was used as a loading control; n = 8 from four independent experiments. *P < 0.05 compared with control; **P < 0.01 compared with untreated pkd2 morphants. The uncropped blots are shown in Supplementary Fig. S2. (C) A combined knockdown of atg5 and pkd2 increased the frequency of cystic phenotype in the Tg(wt1b:GFP) pkd2 morphants. Representative images of the pronephros in the control embryos, pkd2 morphants, and atg5/pkd2 double morphants are shown. Arrows indicate the pronephric cysts. (D) Comparison of the cystic phenotype in different groups. Data represent four independent experiments (n = 81, 86, and 87 per group). **P < 0.01. |

Metformin ameliorates dorsal axis curvature in pkd1a/b and pkd2 morphants. Zebrafish embryos were treated with metformin (10 mM) in supplemented E3 media between 4 and 48 hours post fertilisation (hpf). (A) Representative images showing the common body axis of a control embryo, and the mild and severe dorsal curvature phenotypes of pkd1a/b and pkd2 morphants at 48 hpf. (B) Comparative frequencies of the dorsal curvature phenotype in the pkd1a/b and pkd2 morphants with and without metformin treatment. Data represent two independent experiments. *P < 0.05, **P < 0.01. Scale bar, 200 µm. |