
- Title
-
Regeneration of myelin sheaths of normal length and thickness in the zebrafish CNS correlates with growth of axons in caliber
- Authors
- Karttunen, M.J., Czopka, T., Goedhart, M., Early, J.J., Lyons, D.A.
- Source
- Full text @ PLoS One
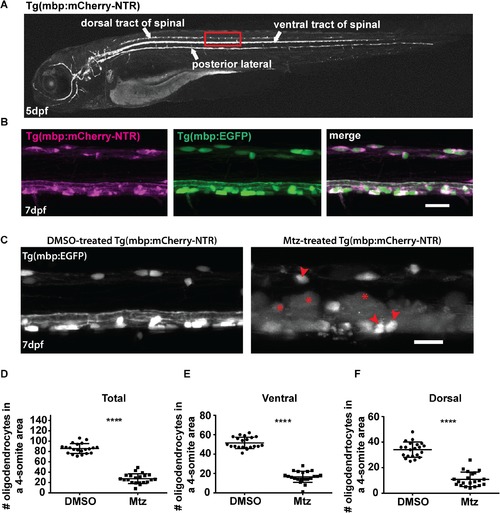
Oligodendrocyte ablation using the Tg(mbp:mCherry-NTR) model. A. Top panel: brightfield image of a Tg(mbp:mCherry-NTR) larva at 5dpf. Bottom panel: fluorescent mage showing the expression of the mbp:mCherry-NTR transgene in the larva. The dorsal and ventral tracts of the spinal cord and the posterior lateral line are indicated. The red box outlines the region that is shown in higher magnification in B (in another animal). B. Lateral views of the spinal cord of double transgenic Tg(mbp:mCherry-NTR);Tg(mbp:EGFP) larvae at 7dpf, showing complete overlap of the mCherry and GFP channels. Scale bar: 20μm.C. Oligodendrocyte ablation in Tg(mbp:mCherry-NTR) animals following two-day treatment with Mtz. Red arrowheads indicate unaffected oligodendrocytes and red asterisks indicate vacuolated structures. Scale bar: 20μm.D-F. Quantification of oligodendrocyte numbers from a four-somite stretch of the spinal cord in the entire region (D) ventral (E) and dorsal (F) tracts of DMSO and Mtz-treated larvae at 7dpf (immediately following treatment). Overall oligodendrocyte number (dorsal and ventral combined), controls: 85.71 ± 2.1 vs treated: 27.48 ± 2.1 (68% reduction, p < 0.0001). n = 21. In the ventral tract, controls: 51.57 ± 1.3 vs treated: 16.57 ± 1.3 (68% reduction, p < 0.0001). In the dorsal tract, mean in controls: 34.14 ±1.3 vs treated: 10.9 ± 1.2 (68% reduction, p < 0.0001). |

Oligodendrocyte numbers remain low in Mtz-treated Tg(mbp:mCherry-NTR) larvae for 7 days following treatment. A. Representative images from the spinal cords of DMSO- and Mtz-treated Tg(mbp:mCherry-NTR) larvae at the time points indicated; GFP channel is shown. B. Quantification of oligodendrocyte numbers from a four-somite stretch of the spinal cord. At 0dpt, mean number of oligodendrocytes in controls: 69.94 ± 11.64 vs treated: 26.76 ± 7.20, p < 0.0001. At 1dpt, controls: 71.43 ± 12.09 vs treated: 37.75 ± 5.34, p < 0.0001. At 2pt, controls: 75.29 ± 6.16 vs treated: 37.22 ± 12.28, p < 0.0001. At 3dpt, controls: 79.29 ± 13.71 vs treated: 50.13 ± 15.78, p < 0.0001. At 4dpt, controls: 76.08 ± 8.92 vs treated: 42.95, p < 0.0001. At 5dpt, controls: 81.92 vs treated: 35.60 ± 10.88, p < 0.0001. At 6dpt, controls: 77.78 ± 10.54 vs treated: 35.64 ± in 11.3, p < 0.0001. At 7dpt, controls: 92.15 ± 9.76 vs treated: 44.25 ± 11.57, p < 0.0001. Statistical significances were determined by multiple t tests per row, without assuming equal standard deviations (Holm-Sidak method). n = no less than 7. Scale bar: 20μm. |

Oligodendrocyte numbers are restored to control levels by 16 days post-treatment. A. Representative images of transversely cut cryosections of spinal cords stained with Hoechst and showing endogenous expression of the mbp:mCherry-NTR transgene. Time points from 7d post-treatment to 16d post-treatment are shown, as indicated. Yellow arrowheads point to examples of double positive cells that were counted as oligodendrocytes.B. Quantification of oligodendrocyte numbers per section. At 7dpt, mean in controls: 6.9 ± 0.44 vs treated: 2.4 ± 0.23 in Mtz-treated sections, p < 0.0001. At 10dpt, controls: 7.6 ± 0.75 vs treated: 4.04 ±0.47, p = 0.0012. At 14dpt, controls: 9.88 ± 0.6 vs treated: 7.3 ± 0.67, p = 0.0095. At 16dpt, controls: 9.46 ± 2.21 vs treated: 8.57 ± 2.58, p = 0.260. All significances were obtained using multiple t tests per row (Holm-Sidak method). n = no less than 5. Scale bars: 20μm. |
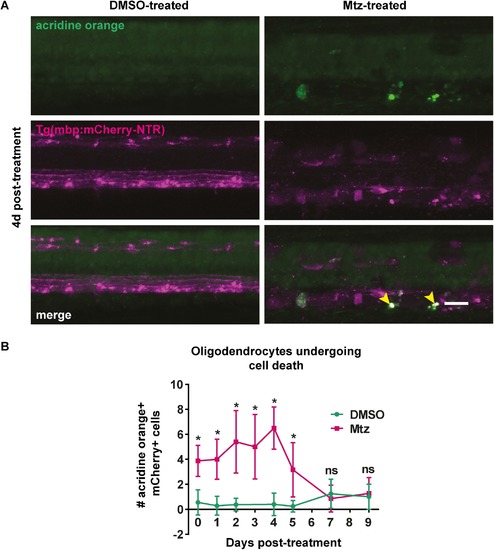
Acridine orange staining reveals oligodendrocytes undergoing cell death following treatment with Mtz. A. Representative images of spinal cords of DMSO- or Mtz-treated Tg(mbp:mCherry-NTR) larvae at 4dpt. Acridine orange labels cells undergoing cell death in green. In Mtz-treated animals several bright green puncta can be seen, and these colocalise with mCherry (yellow arrowheads). B. Quantification of cells that are positive for both mCherry and acridine orange, per four-somite stretch of spinal cord. At 0dpt, control mean: 0.56 ± 1.01 vs treated: 3.88 ± 1.25, p < 0.0001. The number of AO+ cells peaks at 4dpt, when the mean in controls was: 0.4 ± 0.89, vs treated: 6.5 ± 1.69, p < 0.0001. This then reduced so that at 7dpt, controls: 1.25 ± 1.16 vs treated: 0.86 ± 1.07, p = 0.510. All significances were obtained using multiple t tests per row (Holm-Sidak method). n = no less than 8. Scale bar: 20%μm. |
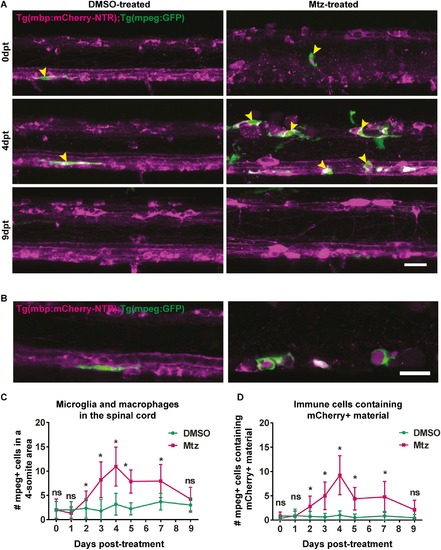
Macrophage and microglia response to oligodendrocyte ablation. A. Representative images of spinal cords of DMSO- or Mtz-treated Tg(mbp:mCherry-NTR) larvae, Green cells are mpeg-expressing microglia and macrophages. Yellow arrowheads indicate examples of mpeg+ cells in contact with the spinal cord. B. Single z-plane images from DMSO- or Mtz-treated Tg(mbp:mCherry-NTR) larvae, Green cells are mpeg-expressing microglia and macrophages and can be seen to surround mCherry positive structures in Mtz-treated animals. C. Quantification of mpeg+ cells in contact with the spinal cord (from a four-somite stretch of the spinal cord) At 0dpt, mean in controls: 2.0 ± 1.73 vs treated: 2.0 ± 2.26, p > 0.9999. At 1dpt, controls: 2.0 ± 1.71 vs treated: 1.31 ± 1.3, p = 0.237. At 2dpt, controls: 2.33 ± 2.02 vs treated: 4.14 ± 1.75, p = 0.022. At 3dpt, controls: 1.79 ± 2.39 vs treated: 8.2 ± 3.68, p < 0.0001). At 4dpt (controls: 3.17 ± 2.22 vs treated: 10.92 ± 4.01, p = 0.00040). At 5dpt, controls: 2.23 ± 1.24 vs treated: 7.84 ± 2.38, p < 0.0001. At 7dpt, controls: 3.69 ± 1.70 vs treated: 7.94 ± 3.42, p = 0.0003. At 9dpt, there is no significant difference between control and Mtz-treated animals (controls: 3.0 ± 1.48 vs treated: 4.22 ± 2.44, p = 0.18). Statistical significance was determined using multiple t tests per row, with a Holm-Sidak method. n = no less than 9. Scale bar: 20μm. D. Quantification of mpeg mpeg+ cells containing mCherry+ material in control Mtz-treated animals.At 1dpt, controls: 0.92 ± 1.38 vs treated: 0.81 ± 1.05 in Mtz-treated animals (p = 0.822). At 2dpt, controls: 0.75 ± 1.06 vs treated: 2.79 ± 2.16 (p = 0.0066).At 3dpt: controls: 0.62 ± 0.77 vs treated: 5.0 ± 2.85 (p < 0.0001). At 4dpt: controls: 1 ± 0.89 vs treated: 9.23 ± 4.02 in Mtz-treated animals (p = 0.00014). At 5dpt: controls: 0.50 ± 0.76 vs treated: 4.39 ± 2.33 (p < 0.0001). At 7dpt: controls: 0.85 ± 0.90 vs treated: 4.75 ± 3.17 cells in Mtz-treated animals (p = 0.00018). At 9dpt: controls: 0.45 ± 0.69 cells in controls and 2.11 ± 1.96 cells in treated animals (p = 0.017). This was not deemed significant by the Holm-Sidak method. Statistical significance was determined using multiple t tests per row, with a Holm-Sidak method. n = no less than 9. Scale bar: 20μm. |

Myelin sheath numbers and lengths per oligodendrocyte are not different between control and treated animals at the remyelinated stage. A. Representative images of single oligodendrocytes in DMSO- or Mtz-treated Tg(mbp:mCherry-NTR) fish, labelled with mbp:EGFP-CAAX. Scale bar: 20μm. B. Quantification of the mean number of sheaths per oligodendrocyte in control and Mtz-treated animals: in controls: 15.89 ± 6.39, vs treated: 19.11 ± 7.36, p = 0.143 (t test). C. Quantification of the mean length of myelin sheath per oligodendrocyte: mean in controls. Mean length of sheath per oligodendrocyte; in controls: 42.21 ± 11.64 vs treated: 37.41 ± 22.14, p = 0.400. n = 19 cells (in 16 animals) for controls, 23 cells (in 19 animals) for treated animals. |

Remyelination coincides with growth of axon caliber between 5dpt and 16dpt. A. Top panel: representative electron micrographs from DMSO- and Mtz-treated Tg(mbp:mCherry-NTR) larvae at 5dpt. Bottom panel: same from larvae 16dpt. Scale bar: 1μm. B. Quantification of the mean perimeter of the 40 largest axons (whether myelinated or unmyelinated) in control and treated larvae at 5, 7, 11 and 16dpt. At 5dpt, mean perimeter of the 40 largest axons in controls: 3.32 μm ± 0.60 μm and treated 3.13 μm ± 0.62 μm. At 7dpt, controls 3.30μm ± 0.39μm and treated 3.19μm ± 0.46μm. At 11dpt, controls 3.21μm ± 0.23μm and treated 3.33μm ± 0.68μm. At 16dpt, the mean perimeter of the largest 40 axons in controls was 4.34 ± 0.63 in controls and in treated, 4.25 ± 0.59. A two-way ANOVA found a significant main effect of time point (p = 0.0003) but a non-significant main effect of treatment condition (p = 0.707) and a non-significant interaction (p = 0.952). |
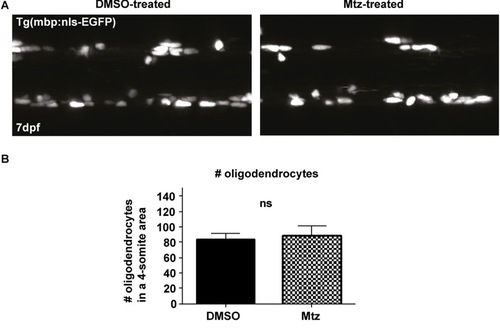
Metronidazole treatment does not affect oligodendrocyte number in and of itself. B. Quantification shows the mean number of oligodendrocytes in a four-somite stretch of the spinal cord: in control: 83.33 ± 8.20 vs treated: 87.92 ± 13.64, p = 0.324. n = 12 for DMSO, 13 for Mtz. |

Oligodendrocyte ablation results in extensive myelin vacuolation. |