
|
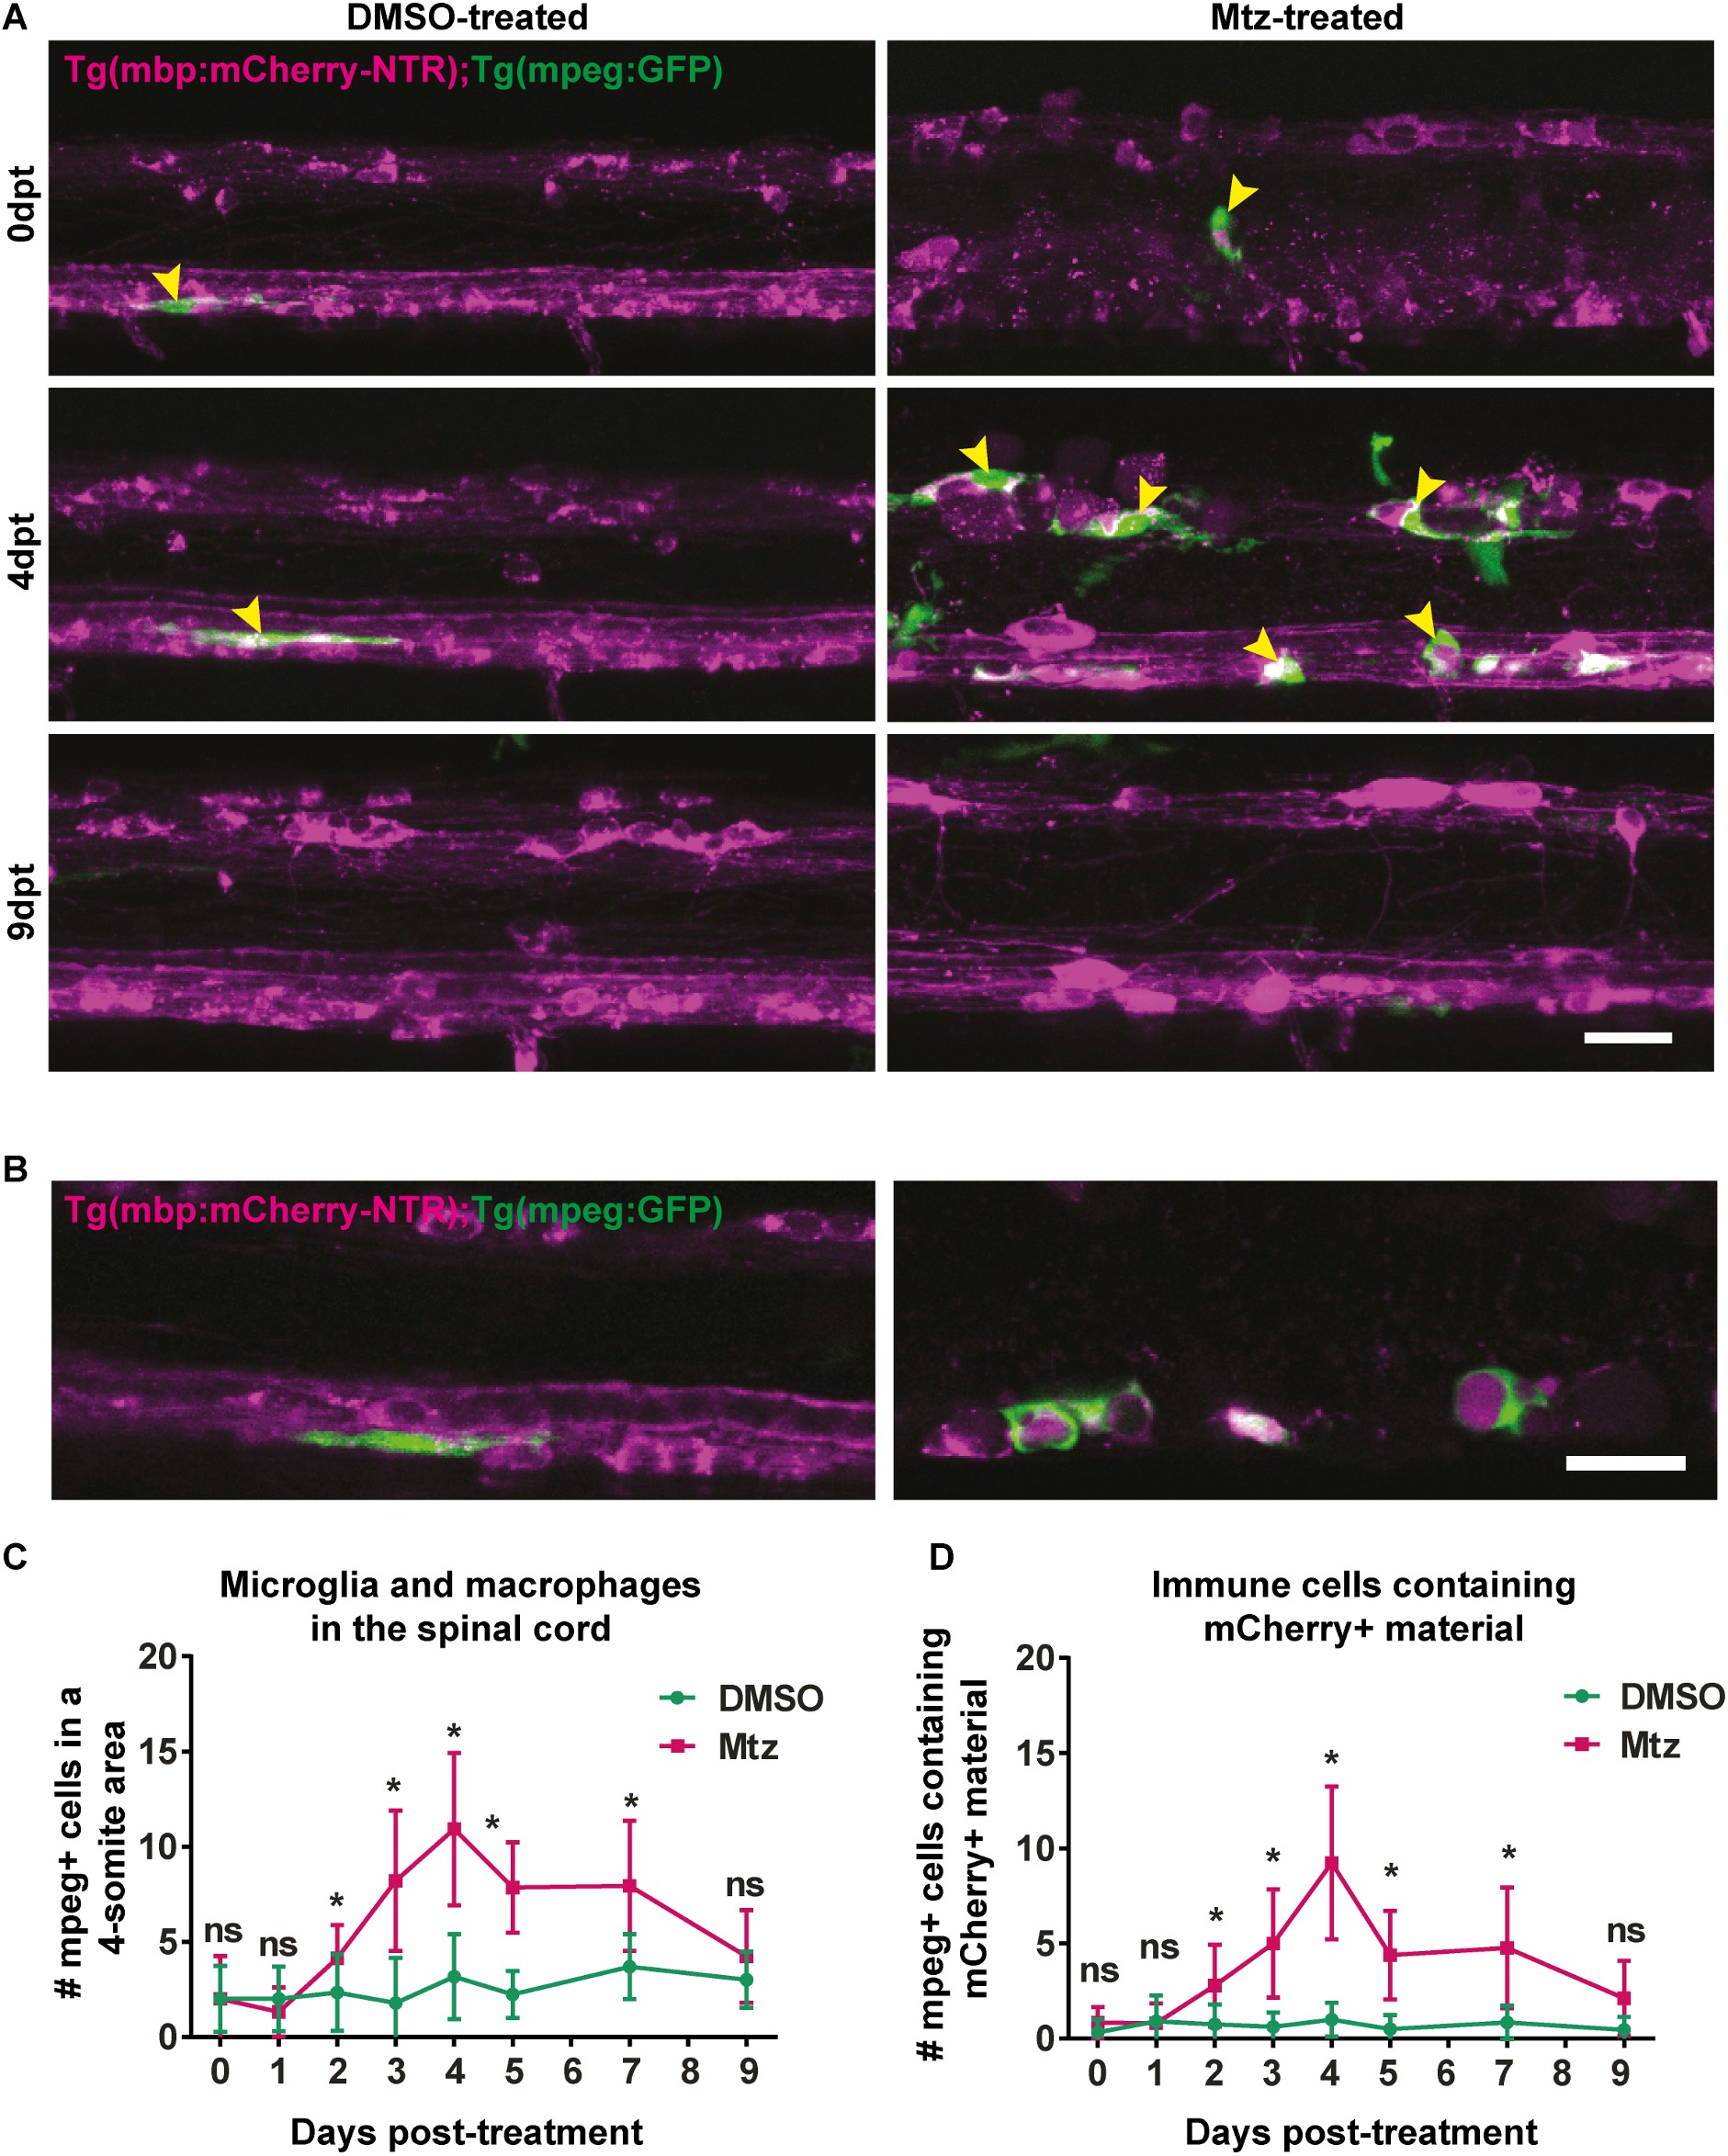
Fig. 5
Macrophage and microglia response to oligodendrocyte ablation.
A. Representative images of spinal cords of DMSO- or Mtz-treated Tg(mbp:mCherry-NTR) larvae, Green cells are mpeg-expressing microglia and macrophages. Yellow arrowheads indicate examples of mpeg+ cells in contact with the spinal cord. B. Single z-plane images from DMSO- or Mtz-treated Tg(mbp:mCherry-NTR) larvae, Green cells are mpeg-expressing microglia and macrophages and can be seen to surround mCherry positive structures in Mtz-treated animals. C. Quantification of mpeg+ cells in contact with the spinal cord (from a four-somite stretch of the spinal cord) At 0dpt, mean in controls: 2.0 ± 1.73 vs treated: 2.0 ± 2.26, p > 0.9999. At 1dpt, controls: 2.0 ± 1.71 vs treated: 1.31 ± 1.3, p = 0.237. At 2dpt, controls: 2.33 ± 2.02 vs treated: 4.14 ± 1.75, p = 0.022. At 3dpt, controls: 1.79 ± 2.39 vs treated: 8.2 ± 3.68, p < 0.0001). At 4dpt (controls: 3.17 ± 2.22 vs treated: 10.92 ± 4.01, p = 0.00040). At 5dpt, controls: 2.23 ± 1.24 vs treated: 7.84 ± 2.38, p < 0.0001. At 7dpt, controls: 3.69 ± 1.70 vs treated: 7.94 ± 3.42, p = 0.0003. At 9dpt, there is no significant difference between control and Mtz-treated animals (controls: 3.0 ± 1.48 vs treated: 4.22 ± 2.44, p = 0.18). Statistical significance was determined using multiple t tests per row, with a Holm-Sidak method. n = no less than 9. Scale bar: 20μm. D. Quantification of mpeg mpeg+ cells containing mCherry+ material in control Mtz-treated animals.At 1dpt, controls: 0.92 ± 1.38 vs treated: 0.81 ± 1.05 in Mtz-treated animals (p = 0.822). At 2dpt, controls: 0.75 ± 1.06 vs treated: 2.79 ± 2.16 (p = 0.0066).At 3dpt: controls: 0.62 ± 0.77 vs treated: 5.0 ± 2.85 (p < 0.0001). At 4dpt: controls: 1 ± 0.89 vs treated: 9.23 ± 4.02 in Mtz-treated animals (p = 0.00014). At 5dpt: controls: 0.50 ± 0.76 vs treated: 4.39 ± 2.33 (p < 0.0001). At 7dpt: controls: 0.85 ± 0.90 vs treated: 4.75 ± 3.17 cells in Mtz-treated animals (p = 0.00018). At 9dpt: controls: 0.45 ± 0.69 cells in controls and 2.11 ± 1.96 cells in treated animals (p = 0.017). This was not deemed significant by the Holm-Sidak method. Statistical significance was determined using multiple t tests per row, with a Holm-Sidak method. n = no less than 9. Scale bar: 20μm.