
Fig. 2
- ID
- ZDB-IMAGE-180221-14
- Publication
- Karttunen et al., 2017 - Regeneration of myelin sheaths of normal length and thickness in the zebrafish CNS correlates with growth of axons in caliber
- All Figures
- Figures for Karttunen et al., 2017
|
Fig. 2
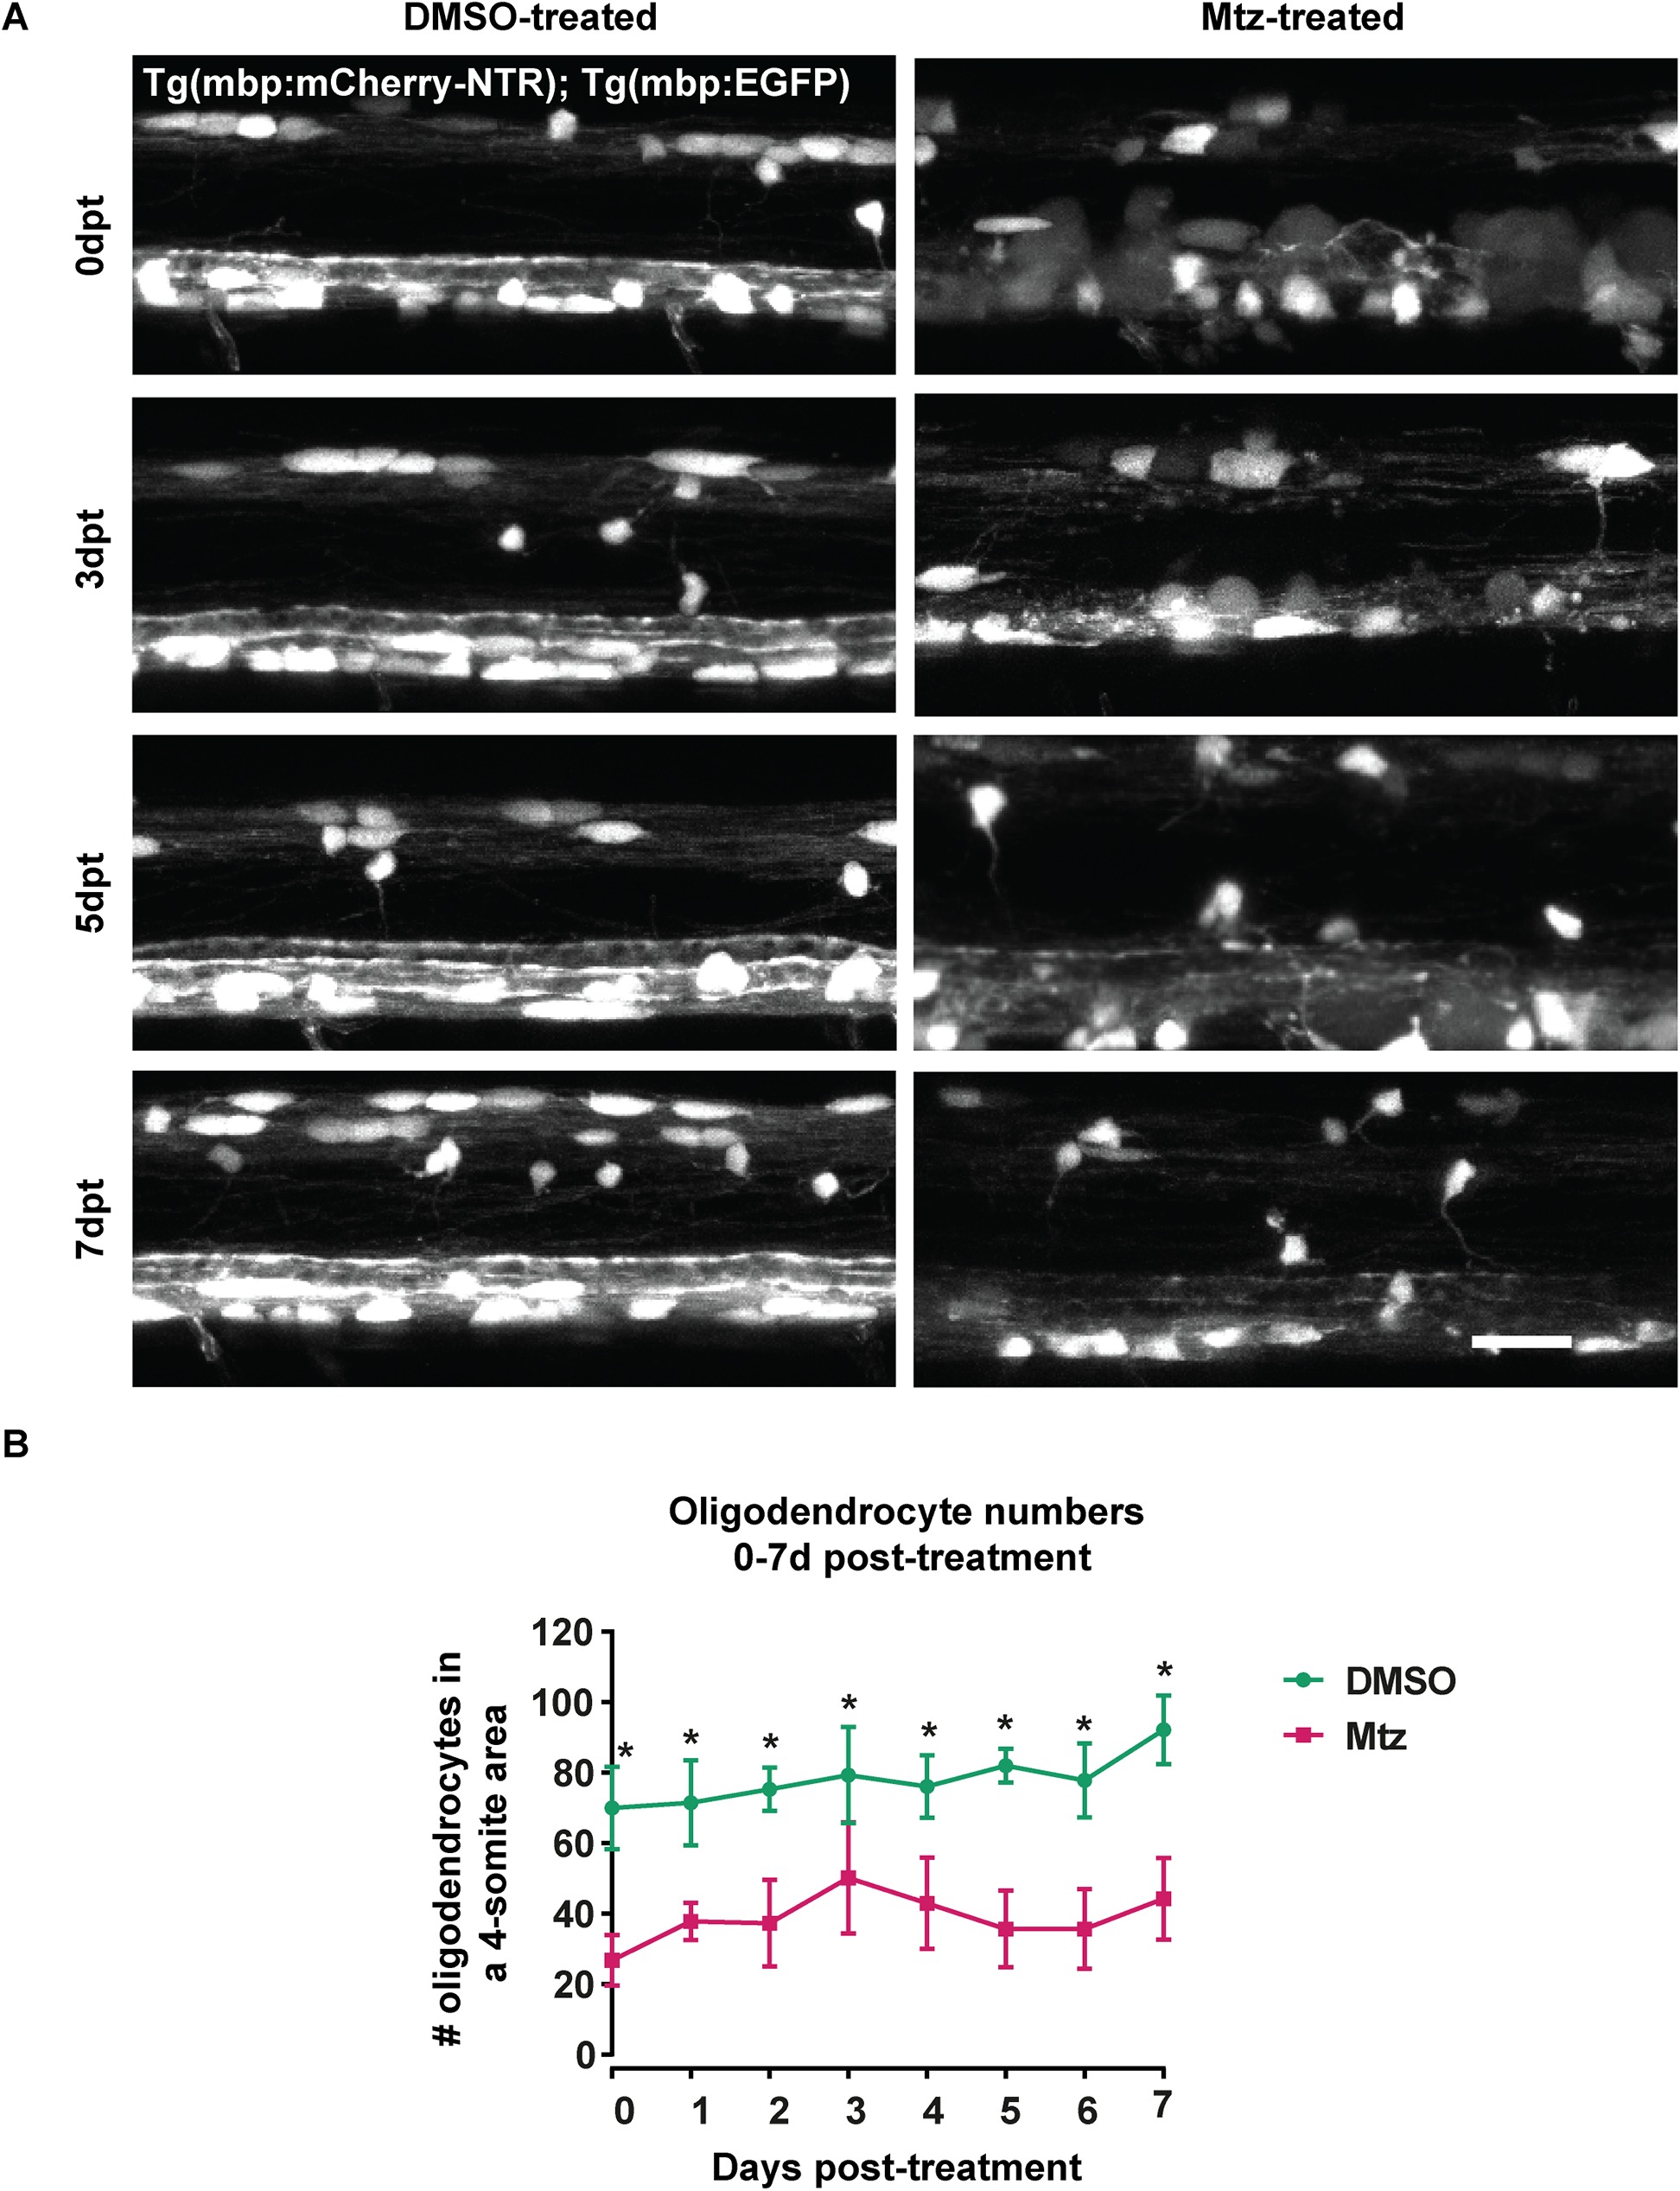
Oligodendrocyte numbers remain low in Mtz-treated Tg(mbp:mCherry-NTR) larvae for 7 days following treatment.
A. Representative images from the spinal cords of DMSO- and Mtz-treated Tg(mbp:mCherry-NTR) larvae at the time points indicated; GFP channel is shown. B. Quantification of oligodendrocyte numbers from a four-somite stretch of the spinal cord. At 0dpt, mean number of oligodendrocytes in controls: 69.94 ± 11.64 vs treated: 26.76 ± 7.20, p < 0.0001. At 1dpt, controls: 71.43 ± 12.09 vs treated: 37.75 ± 5.34, p < 0.0001. At 2pt, controls: 75.29 ± 6.16 vs treated: 37.22 ± 12.28, p < 0.0001. At 3dpt, controls: 79.29 ± 13.71 vs treated: 50.13 ± 15.78, p < 0.0001. At 4dpt, controls: 76.08 ± 8.92 vs treated: 42.95, p < 0.0001. At 5dpt, controls: 81.92 vs treated: 35.60 ± 10.88, p < 0.0001. At 6dpt, controls: 77.78 ± 10.54 vs treated: 35.64 ± in 11.3, p < 0.0001. At 7dpt, controls: 92.15 ± 9.76 vs treated: 44.25 ± 11.57, p < 0.0001. Statistical significances were determined by multiple t tests per row, without assuming equal standard deviations (Holm-Sidak method). n = no less than 7. Scale bar: 20μm.