
|
Fig. 3
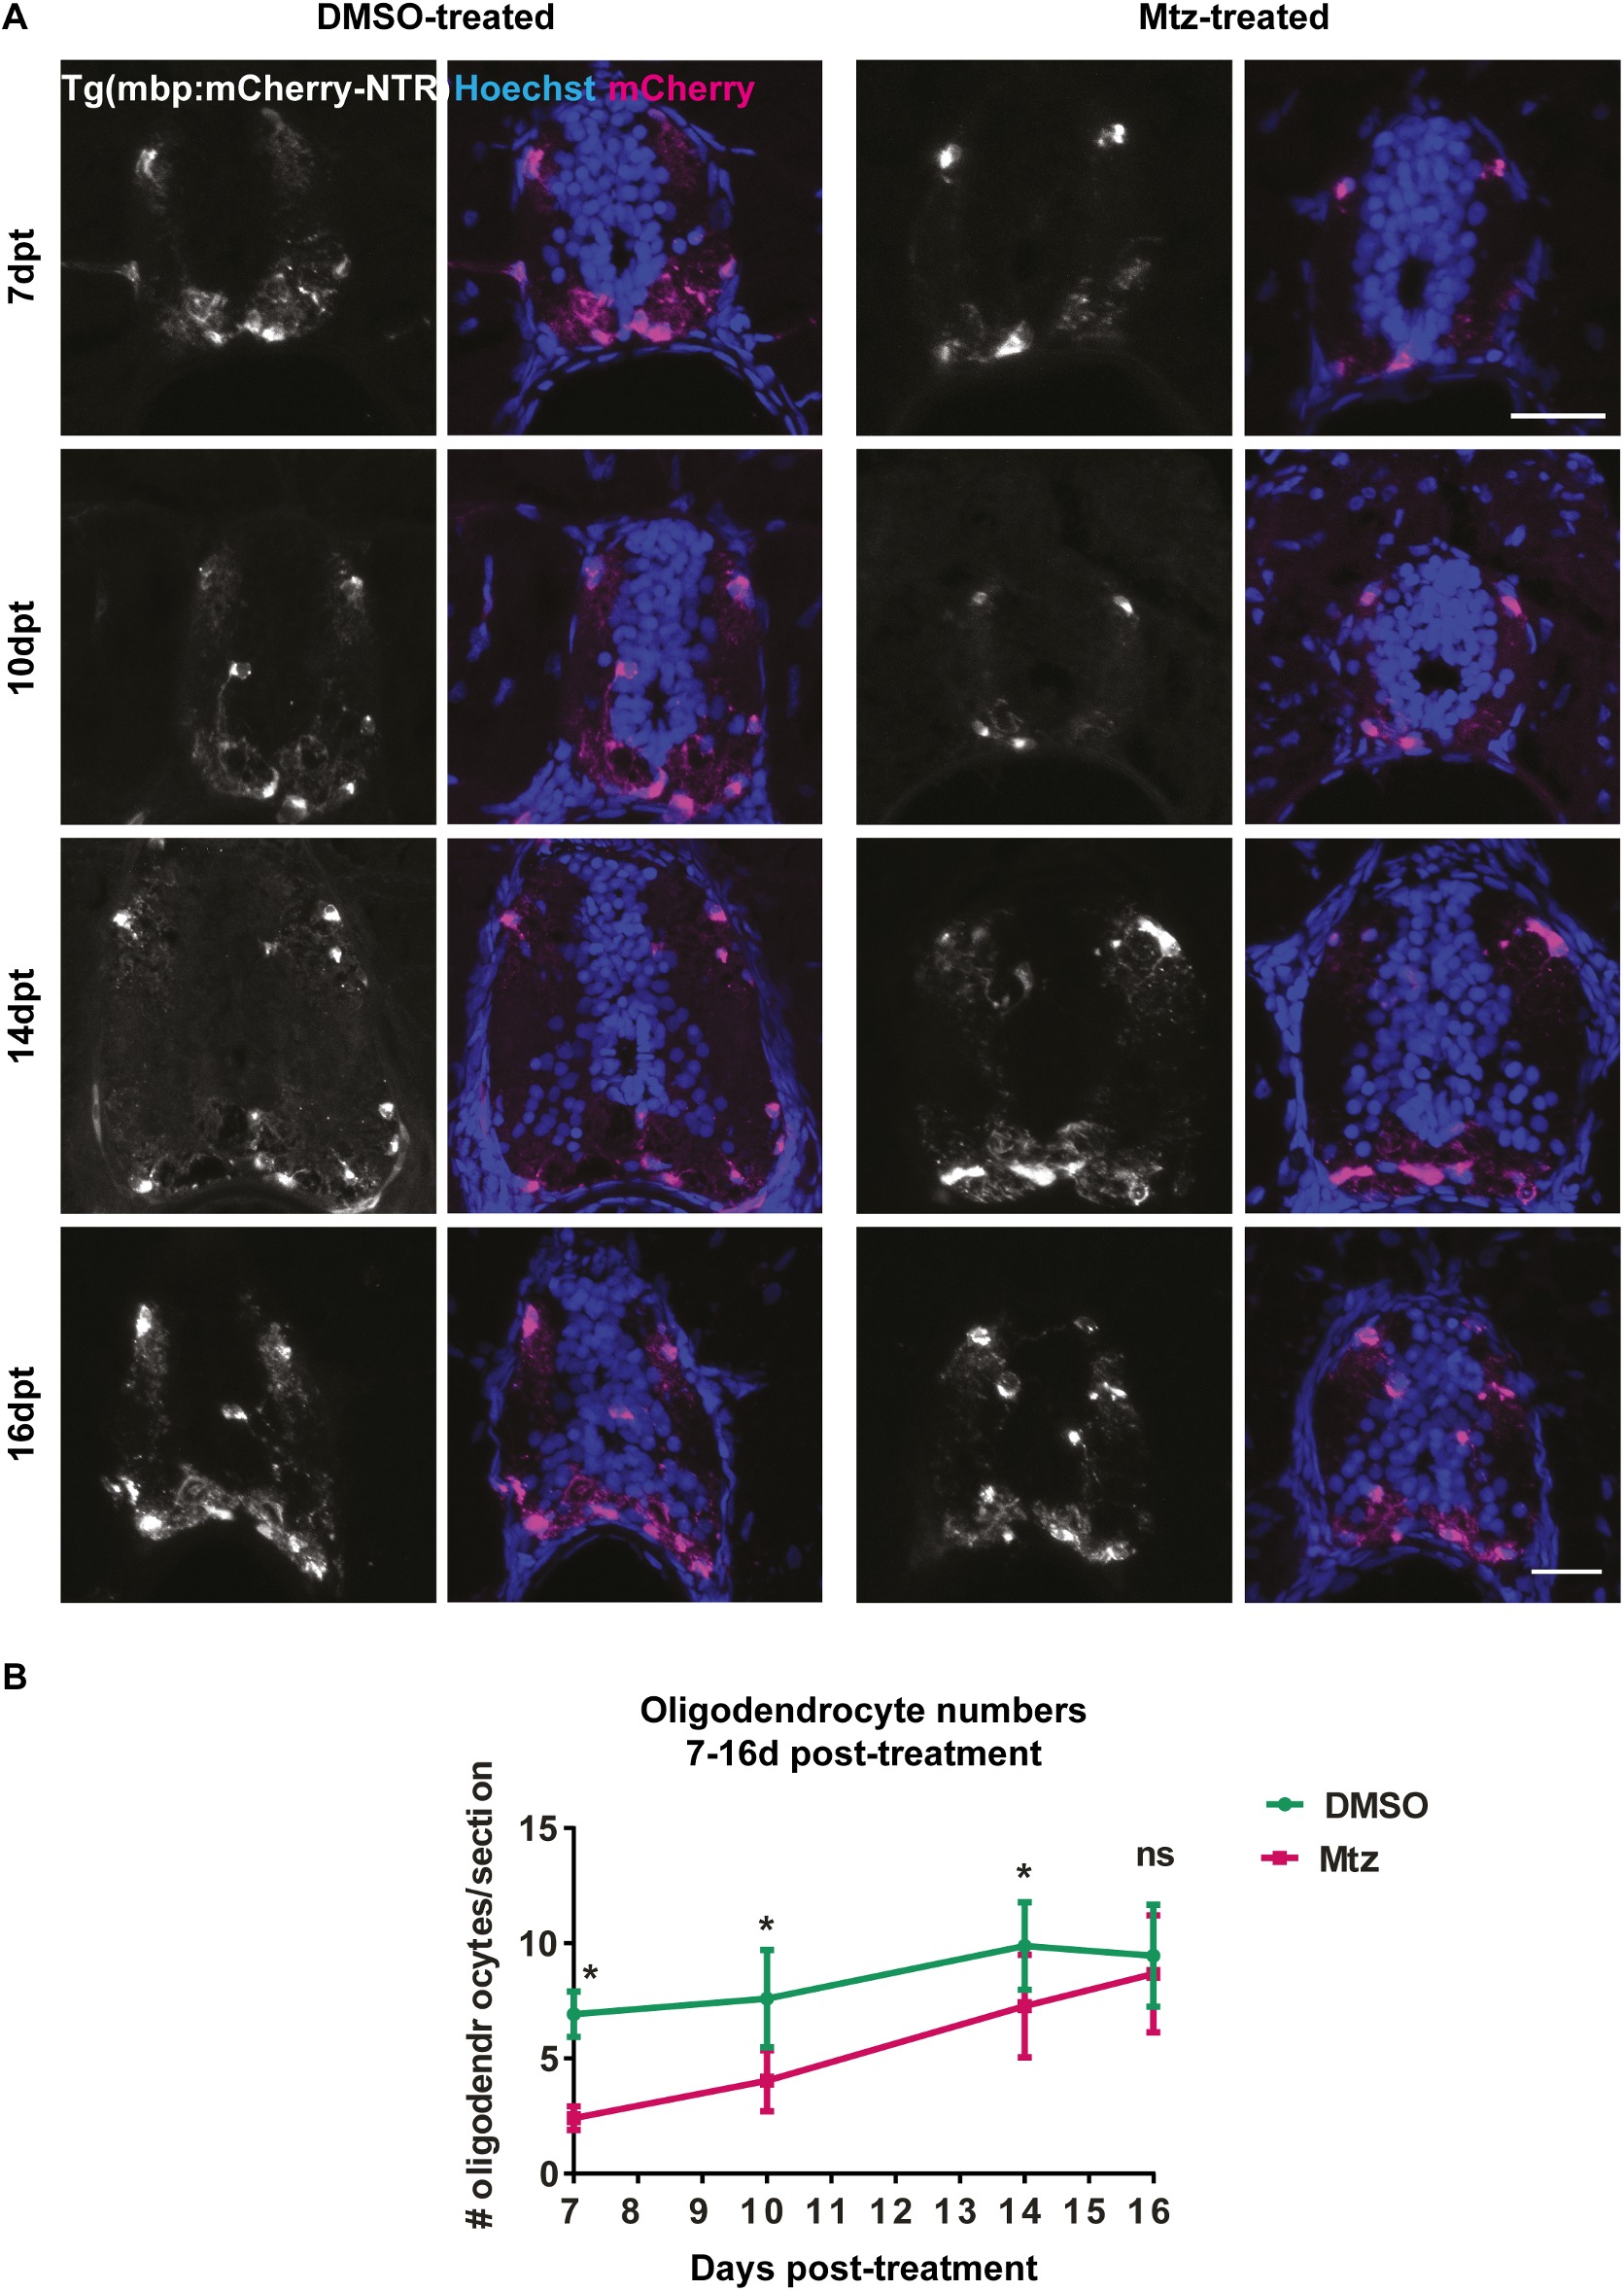
Oligodendrocyte numbers are restored to control levels by 16 days post-treatment.
A. Representative images of transversely cut cryosections of spinal cords stained with Hoechst and showing endogenous expression of the mbp:mCherry-NTR transgene. Time points from 7d post-treatment to 16d post-treatment are shown, as indicated. Yellow arrowheads point to examples of double positive cells that were counted as oligodendrocytes.B. Quantification of oligodendrocyte numbers per section. At 7dpt, mean in controls: 6.9 ± 0.44 vs treated: 2.4 ± 0.23 in Mtz-treated sections, p < 0.0001. At 10dpt, controls: 7.6 ± 0.75 vs treated: 4.04 ±0.47, p = 0.0012. At 14dpt, controls: 9.88 ± 0.6 vs treated: 7.3 ± 0.67, p = 0.0095. At 16dpt, controls: 9.46 ± 2.21 vs treated: 8.57 ± 2.58, p = 0.260. All significances were obtained using multiple t tests per row (Holm-Sidak method). n = no less than 5. Scale bars: 20μm.