
Fig. 1
- ID
- ZDB-FIG-180221-8
- Publication
- Karttunen et al., 2017 - Regeneration of myelin sheaths of normal length and thickness in the zebrafish CNS correlates with growth of axons in caliber
- Other Figures
- All Figure Page
- Back to All Figure Page
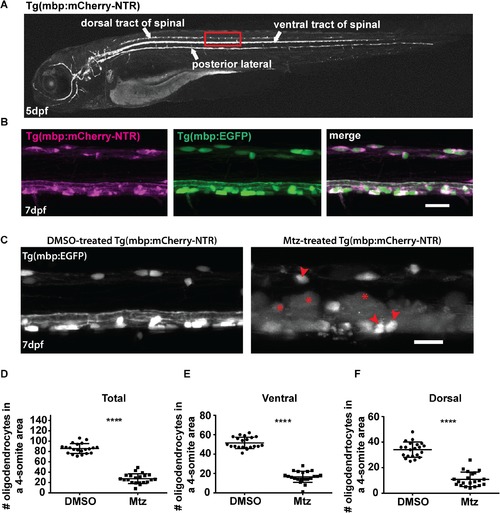
Oligodendrocyte ablation using the Tg(mbp:mCherry-NTR) model. A. Top panel: brightfield image of a Tg(mbp:mCherry-NTR) larva at 5dpf. Bottom panel: fluorescent mage showing the expression of the mbp:mCherry-NTR transgene in the larva. The dorsal and ventral tracts of the spinal cord and the posterior lateral line are indicated. The red box outlines the region that is shown in higher magnification in B (in another animal). B. Lateral views of the spinal cord of double transgenic Tg(mbp:mCherry-NTR);Tg(mbp:EGFP) larvae at 7dpf, showing complete overlap of the mCherry and GFP channels. Scale bar: 20μm.C. Oligodendrocyte ablation in Tg(mbp:mCherry-NTR) animals following two-day treatment with Mtz. Red arrowheads indicate unaffected oligodendrocytes and red asterisks indicate vacuolated structures. Scale bar: 20μm.D-F. Quantification of oligodendrocyte numbers from a four-somite stretch of the spinal cord in the entire region (D) ventral (E) and dorsal (F) tracts of DMSO and Mtz-treated larvae at 7dpf (immediately following treatment). Overall oligodendrocyte number (dorsal and ventral combined), controls: 85.71 ± 2.1 vs treated: 27.48 ± 2.1 (68% reduction, p < 0.0001). n = 21. In the ventral tract, controls: 51.57 ± 1.3 vs treated: 16.57 ± 1.3 (68% reduction, p < 0.0001). In the dorsal tract, mean in controls: 34.14 ±1.3 vs treated: 10.9 ± 1.2 (68% reduction, p < 0.0001). |