
|
Fig. 4
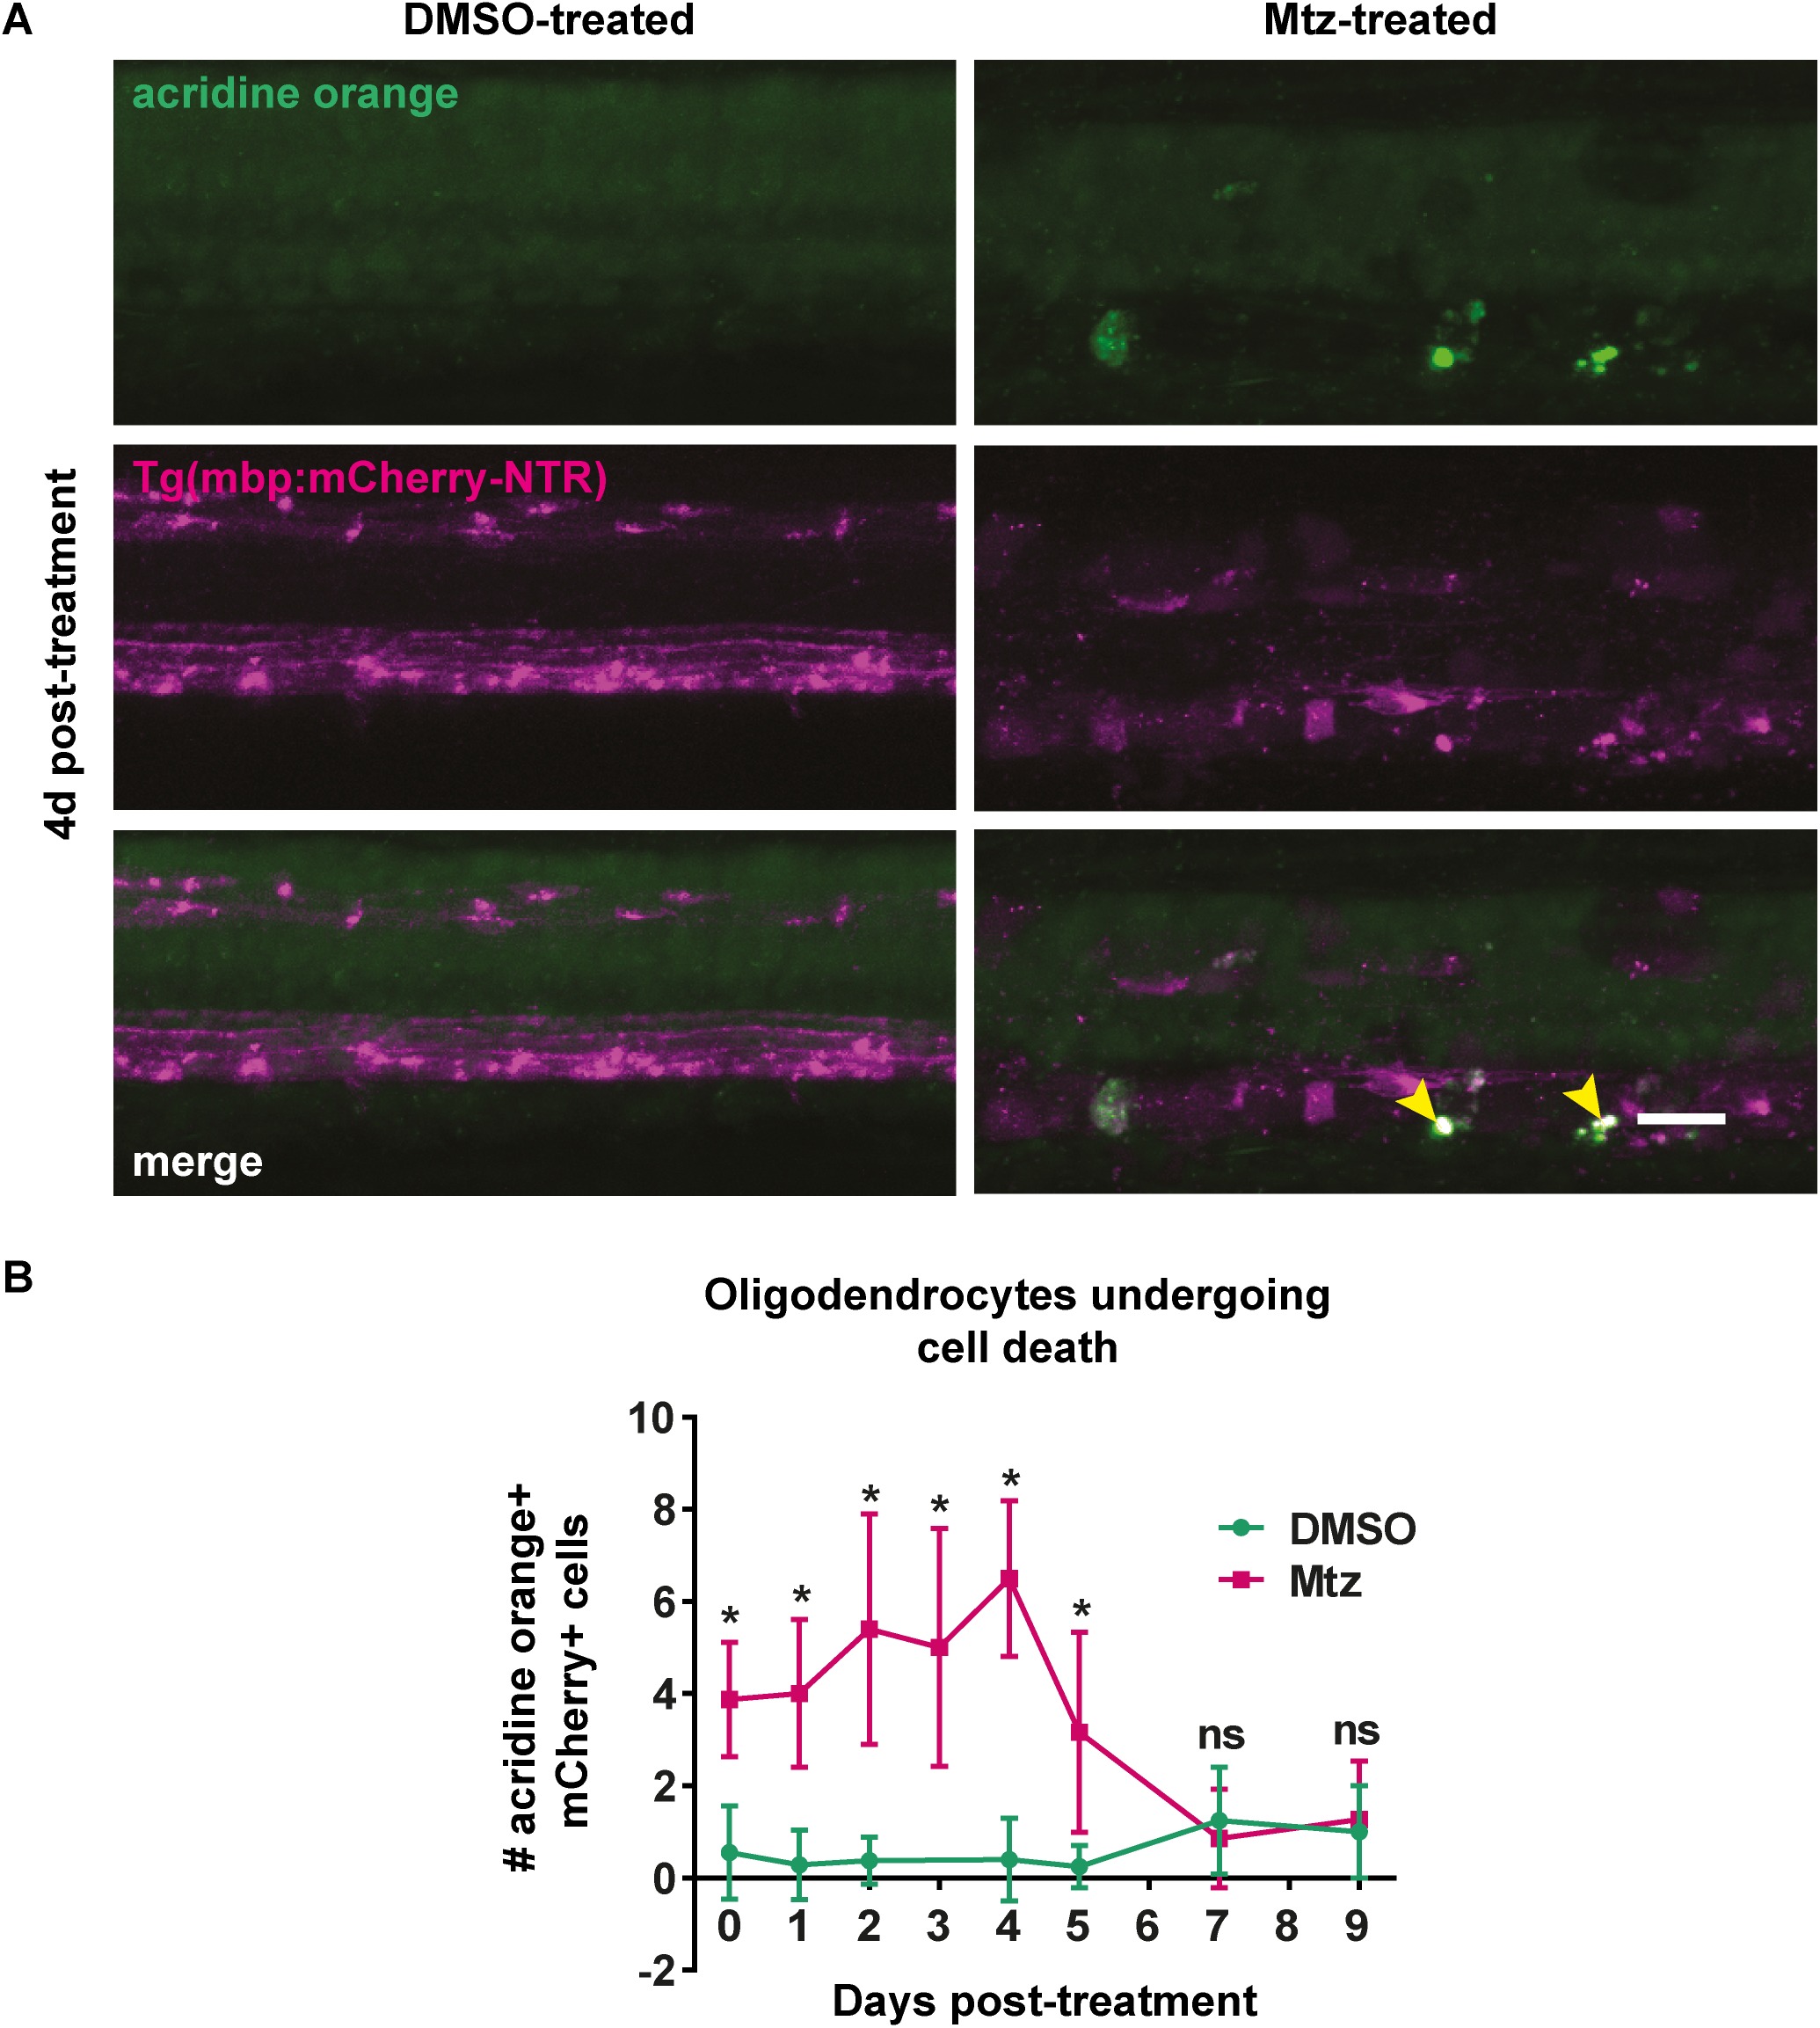
Acridine orange staining reveals oligodendrocytes undergoing cell death following treatment with Mtz.
A. Representative images of spinal cords of DMSO- or Mtz-treated Tg(mbp:mCherry-NTR) larvae at 4dpt. Acridine orange labels cells undergoing cell death in green. In Mtz-treated animals several bright green puncta can be seen, and these colocalise with mCherry (yellow arrowheads). B. Quantification of cells that are positive for both mCherry and acridine orange, per four-somite stretch of spinal cord. At 0dpt, control mean: 0.56 ± 1.01 vs treated: 3.88 ± 1.25, p < 0.0001. The number of AO+ cells peaks at 4dpt, when the mean in controls was: 0.4 ± 0.89, vs treated: 6.5 ± 1.69, p < 0.0001. This then reduced so that at 7dpt, controls: 1.25 ± 1.16 vs treated: 0.86 ± 1.07, p = 0.510. All significances were obtained using multiple t tests per row (Holm-Sidak method). n = no less than 8. Scale bar: 20%μm.