
- Title
-
Neurotransmitter-Regulated Regeneration in the Zebrafish Retina
- Authors
- Rao, M.B., Didiano, D., Patton, J.G.
- Source
- Full text @ Stem Cell Reports
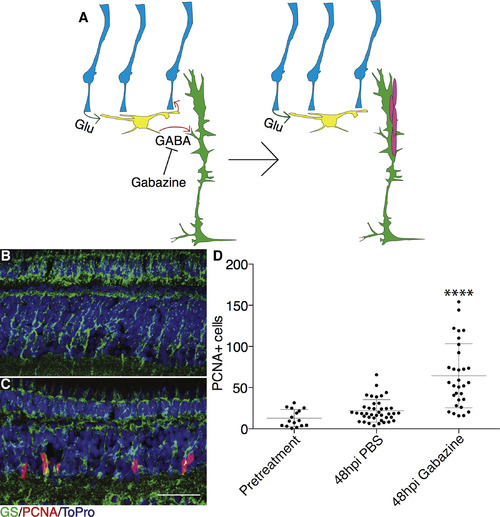
Gabazine Injections Cause Time-Dependent Spontaneous Proliferation in Undamaged Retinas (A) Model illustrating effects of gabazine injection on MG proliferation. (B and C) Wild-type eyes were injected with PBS (B) or 12.5 nmol gabazine (C) into one eye. Fish recovered for 48 hr after gabazine injections before proliferation was measured. Representative images are small portions of entire retina. Scale bar, 100 μm. (D) Proliferating cells were counted across whole sections by PCNA staining for pretreatment (n = 16 eyes analyzed), PBS injection (n = 40), and gabazine injection (n = 31). hpi, hours post injection. One-way ANOVA was used; error bars denote SD; ∗∗∗∗p < 0.0001. |

NBQX Injections Cause Time-Dependent Spontaneous Proliferation in Undamaged Retinas (A) Model illustrating effects of NBQX injections on MG proliferation. (B and C) Wild-type eyes were injected with PBS (B) or 25 nmol NBQX (C) into one eye. Fish recovered for 72 hr after NBQX injections (B and C) before proliferation was measured. Representative images are small portions of entire retina. Scale bar, 100 μm. (D) Proliferating cells were counted across whole sections by PCNA staining for pretreatment (n = 5 eyes analyzed), PBS injection (n = 19), and NBQX injection (n = 16). hpi, hours post injection. One-way ANOVA was used; error bars denote SD; ∗∗∗∗p < 0.0001. |
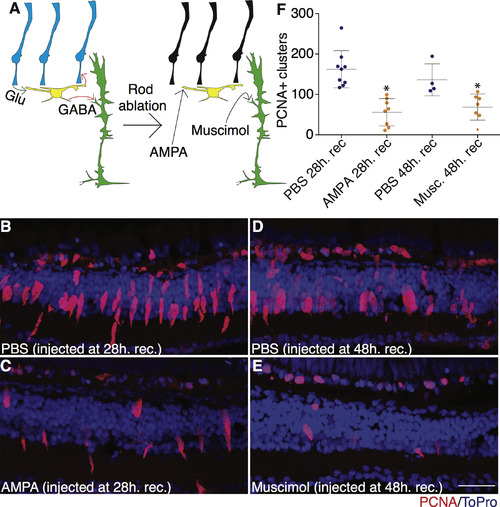
AMPA and Muscimol Injections Suppress Regeneration in Damaged Retinas (A) Model illustrating effects of muscimol and AMPA injections on MG proliferation. (B–E) Tg(zop:nfsb-EGFP)nt19 fish were treated with 10 mM metronidazole for 24 hr, then allowed to recover. Fish were then anesthetized and injected with either AMPA at 28-hr recovery (C) or muscimol at 48-hr recovery (E). PBS controls were also anesthetized and injected at 28-hr (B) or 48-hr recovery (D). All injected eyes were removed at 52-hr recovery. Proliferation was assessed by PCNA staining. Representative images are small portions of the entire retina. Scale bar, 100 μm. (F) Clusters of proliferating cells were measured across entire sections for PBS at 28 hr recovery (n = 9 eyes analyzed), AMPA at 28 hr recovery (n = 8), PBS at 48 hr recovery (n = 4), and muscimol at 48 hr recovery (n = 7). Two-tailed Student’s t test was used; error bars denote SD; ∗p < 0.05. |
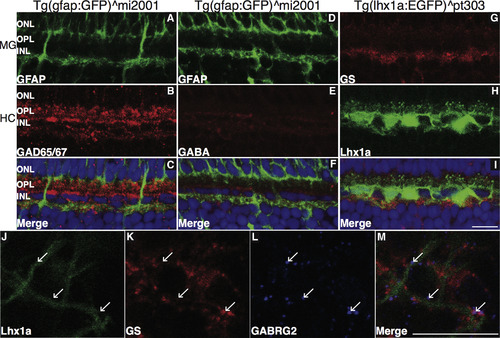
Close Association of MG and HC Processes in the INL (A–I) Tg(gfap:GFP)mi2001 and Tg(lhx1a:EGFP)pt303 retina sections were stained for GAD65/67 (A–C), GABA (D–F), or GS (G–I). Scale bar, 100 μm. (J–M) Co-localization of MG and HC markers was observed in the INL. Tg(lhx1a:EGFP)pt303 retinas were removed, stained for GS and GABRG2, and the area of co-localization imaged in flat mount. Arrows indicate GABRG2 puncta. Scale bar, 100 μm. See also Figure S6. |

Expression of DNγ2 in MG of Undamaged Retina Causes Increased Proliferation (A) Model illustrating effects of electroporation of DNγ2 into MG on proliferation. (B–E) A GFAP:mCh-DNγ2 construct was electroporated into one retina of undamaged Tg(gfap:GFP)mi2001 fish. GFP expression (B), mCherry expression (C), and staining for PCNA (D) all co-labeled in the same cell (E). Scale bar, 100 μm. (F) Total number of PCNA-expressing cells was measured for pA electroporation (n = 9 eyes analyzed) and DNγ2 (n = 12). Two-tailed Student’s t test was used; error bars denote SD; ∗p < 0.05. See also Figure S7. |

Injection of Gabazine or NBQX into Undamaged Eyes Causes Upregulation of Factors Associated with Regeneration Gabazine (A–C, G–I) or NBQX (D–F, J–L) was injected into one eye of Tg(tuba1a:GFP) (A–F) or Tg(her4:dRFP) (G–L) fish. Fish were allowed to recover for 72 hr, after which retinas were removed and stained for PCNA. Both GFP and dRFP expression co-labeled with PCNA. Arrows indicate co-localization of transgene and PCNA. Scale bar, 100 μm. |
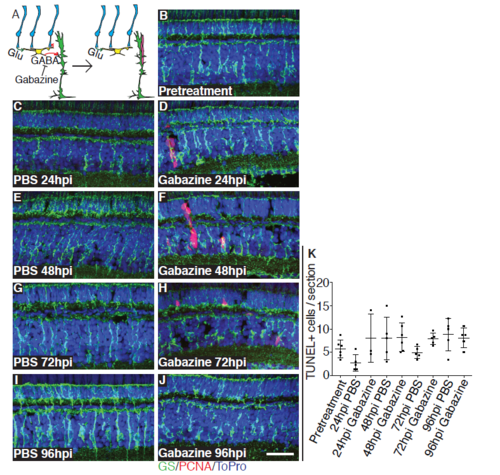
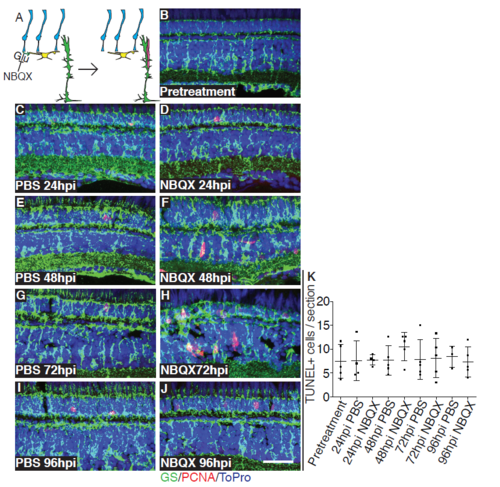
Gabazine injection causes time dependent spontaneous proliferation in undamaged retinas, related to Figure 1. Model illustrating predicted effects of gabazine on MG proliferation (A). Eyes were injected with PBS or 12.5 nmol of gabazine and allowed to recover. Eyes were removed before injection (B) as well as at 24hpi (C,D), 48hpi (E (same as Figure 1B), F), 72hpi (G,H), or 96hpi (I,J) and proliferation assessed by PCNA staining. Scale bar is 100μm. Apoptosis was also measured before injection (n=6) and after PBS or gabazine injection at 24hpi (n=5, 3), 48hpi (n=5, 6), 72hpi (n=5, 5), and 96hpi (n=5, 5) by TUNEL (K). A one-way ANOVA was used; Error bars = SD. |
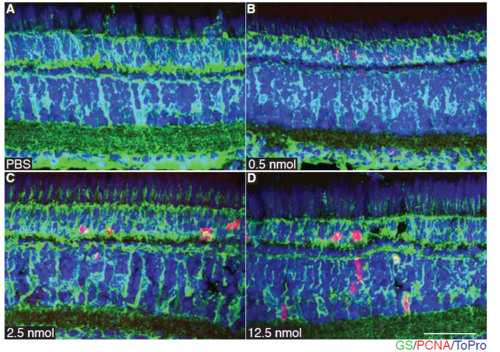
Gabazine induced spontaneous proliferation 13 is dose dependent, related to Figure 1. WT fish were injected with PBS (A), 0.5 nmol (B), 2.5 nmol (C), or 12.5 nmol (D) and proliferation measured at 48hpi by PCNA staining. Representative images are small portions of entire retina. Representative images are small portions of total retina sections. Scale bar is 100μm. |
NBQX injection causes time dependent spontaneous proliferation in undamaged retinas, related to Figure 2. Model illustrating predicted effects of NBQX injections on MG proliferation (A). Eyes were injected with 25 nmol of NBQX or PBS and allowed to recover. Eyes were removed before injection (B) as well as at 24hpi (C, D), 48hpi (E, F), 72hpi (G (same as Figure 2B), H), or 96hpi (I, J) and proliferation assessed by PCNA staining. Scale bar is 100μm. Apoptosis was also measured before injection (n=5) and after PBS or NBQX injection at 24hpi (n=4, 4), 48hpi (n=5, 5), 72hpi (n=5, 5), and 96hpi (n=3, 5) by TUNEL (K). A one-way ANOVA was used; Error bars = SD. |
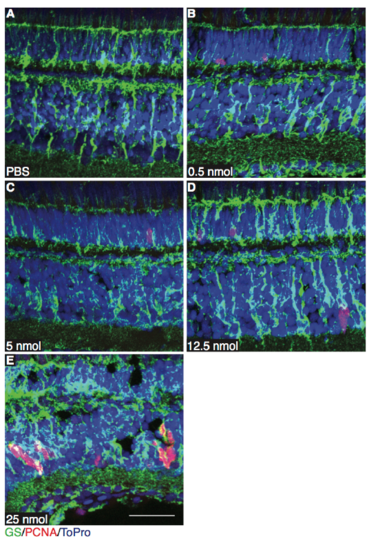
NBQX induced spontaneous proliferation is dose dependent, related to Figure 2. WT fish were injected with PBS (A), 0.5 nmol (B), 5 nmol (C), 12.5 nmol (D), or 25 nmol (E) and proliferation measured at 72hpi by PCNA staining. Representative images are small portions of total retina sections. Representative images are small portions of total retina sections. Scale bar is 100μm. |
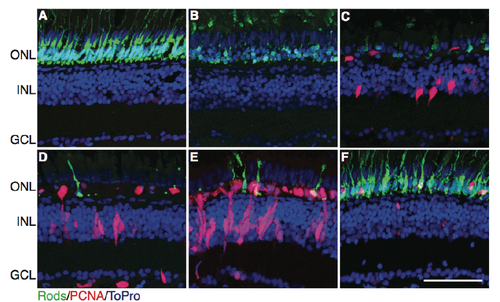
Timeline of regeneration in 36 Tg(zop:nfsb-EGFP)nt19 37 after MTZ treatment, related to Figure 3. Tg(zop:nfsb-EGFP)nt19 fish were placed 38 in egg water containing 10mM Metronidazole and treated for 24 hours, then 39 returned to normal egg water to recover. Eyes were removed and proliferation 40 assessed by PCNA staining. Times of recovery observed were pretreatment (A), 0h. 41 recovery (B), 52h. recovery (C), 72h. recovery (D), 96h. recovery (E), and 28 days 42 recovery (F). Scale bar is 100μm. |
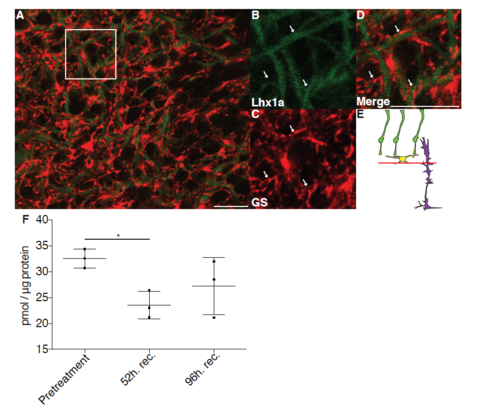
MG processes surround 44 HC processes in INL, related to Figure 4. Tg(lhx1a:EGFP)pt303 retinas were removed and stained for GS and prepared for flat mount imaging. The region of the INL where MG and HCs overlap (red line in E) was imaged. Arrows indicate regions of close association between MG and HCs. Scale bar is 100μm. Tg(zop:nfsb-EGFP)nt19 fish were treated with MTZ and allowed to recover. Whole retinas were removed at indicated time points and subjected to HPLC. Levels of GABA were measured (F, related to section MG are poised to detect changes in GABA levels). A one-way ANOVA was used; n=3 biological replicates for each timepoint; Error bars = SD; * = p<0.05. |
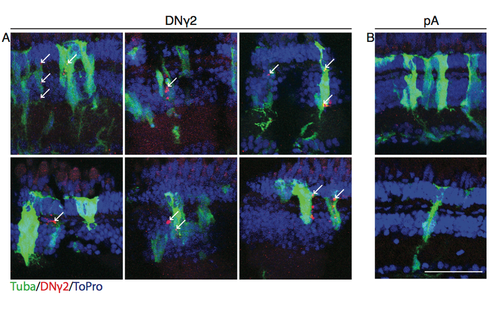
Expression of DNγ2 in proliferating 54 cells, related to Figure 5. Tg(tuba1a:GFP) fish were electroporated with a construct containing either a GFAP:mCh-DNγ2 or GFAP:mCh-pA and allowed to recover for 96 hours, after which retinas were stained for GFP and mCherry to measure co-localization. Representative images of DNγ2 (A) and pA (B) are small portions of entire retinas. Arrows indicate co-localization of mCh and GFP. Scale bar is 100μm. |