
Fig. S6
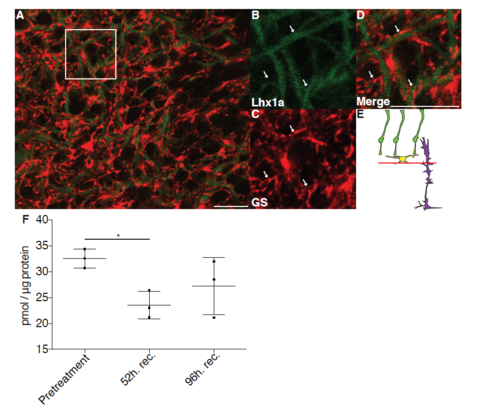
MG processes surround 44 HC processes in INL, related to Figure 4. Tg(lhx1a:EGFP)pt303 retinas were removed and stained for GS and prepared for flat mount imaging. The region of the INL where MG and HCs overlap (red line in E) was imaged. Arrows indicate regions of close association between MG and HCs. Scale bar is 100μm. Tg(zop:nfsb-EGFP)nt19 fish were treated with MTZ and allowed to recover. Whole retinas were removed at indicated time points and subjected to HPLC. Levels of GABA were measured (F, related to section MG are poised to detect changes in GABA levels). A one-way ANOVA was used; n=3 biological replicates for each timepoint; Error bars = SD; * = p<0.05. |