
- Title
-
Leader Cells Define Directionality of Trunk, but Not Cranial, Neural Crest Cell Migration
- Authors
- Richardson, J., Gauert, A., Briones Montecinos, L., Fanlo, L., Alhashem, Z.M., Assar, R., Marti, E., Kabla, A., Härtel, S., Linker, C.
- Source
- Full text @ Cell Rep.
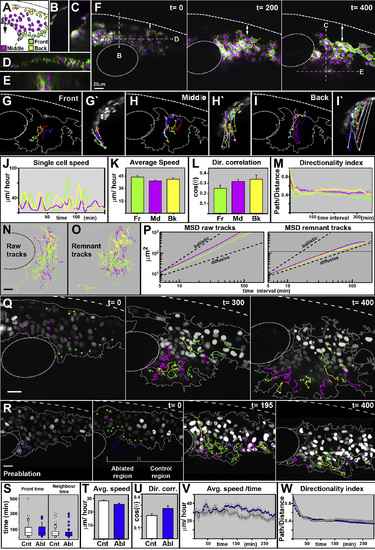
CNC Migration Does Not Require Leader Cells Time in minutes. OV: otic vesicle. Lateral views and anterior to the right. The error bars represent SEM. (A) Diagram of CNC cells anterior to the otic vesicle. The arrow shows the directional correlation vector. (B-E) Transverse (B and C) and coronal sections (D and E) indicated in (F). (F) Selected frames of Movie S2. The double arrow shows the growing dorsal area void of CNC cells. (G-I′) Tracks of representative front (Fr; G and G′), middle (Md; H and H′), and back (Bk; I and I′) cells. Lateral (G-I′) and transversal (G′, H′, and I′) view. The grey arrows connect the initial to the final track point, showing the deviation produced by 2D tracking. (J) Speed of representative cells over time. (K) Average cell speed. (L) Directional correlation. (M) Directionality index. (N and O) Cell tracks of raw (N) and remnant (O) movement. (P) MSD of raw and remnant trajectories. The dashed lines show the ballistic and diffusive curves. The solid black line marks the average cell size. A logarithmic scale is used in X and Y. Front, Fr = 38, middle, Md = 39, and back, Bk = 24 cells were analyzed from 4 embryos. (Q) Tracks of cells that initiate migration at the front of the group (green) and cells that finalize migration at the front of the group. Selected frames of Movie S3. (R) Preablation frame. The ablated nuclei are marked in blue. Selected frames of Movie S4. The color green shows the nuclei at the front, the color magenta shows them at the middle, and the color yellow shows them at the back after ablation. The dashed blue line shows the position of themembrane before ablation. (S-W) A comparison between control (white) and ablated cells (blue) of time at the front of the group and of neighboring nuclei (S), average speed (T), directional correlation (U), average speed over time (V), and directionality ratio (W). A total of 30 and 33 cells from ablated and non-ablated regions, from 3 embryos, were analyzed. All scale bars = 20 µm. See also Movies S2, S3, and S4. |
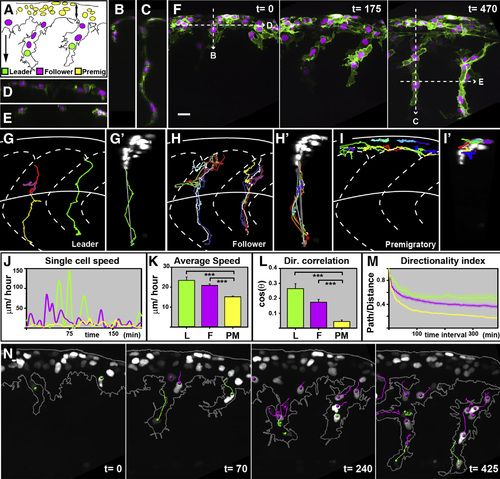
TNC Are Formed of Three Different Cell Populations Time in minutes. Lateral view and anterior to the left. The error bars represent SEM. (A) Diagram of migrating TNC cell leader, L, green; follower, F, magenta; and premigratory, PM, yellow. The double arrow marks the premigratory area. The simple arrow shows the directional correlation vector. (B-E) Transversal (B and C) and coronal (D and E) optical sections indicated in (F). (F) Representative frames of migrating TNC cell (Movie S5). (G-I′) Tracks of representative L (G and G′), F (H and H′), and PM (I and I′) cells. Lateral (G, H, and I) and transversal (G′, H′, and I′) views. (J) Speed of representative cells over time. (K) Average cell speed. (L) Directional correlation. (M) Directionality index (L = 15, F = 83, and PM = 85 cells, from 6 embryos, were analyzed). (N) Representative frames of migrating TNC cell (Movie S8) showing the tracks of L and F cells. All scale bars = 20 µm, valid for all panels. See also Movies S5, S6, S8, and S9. |
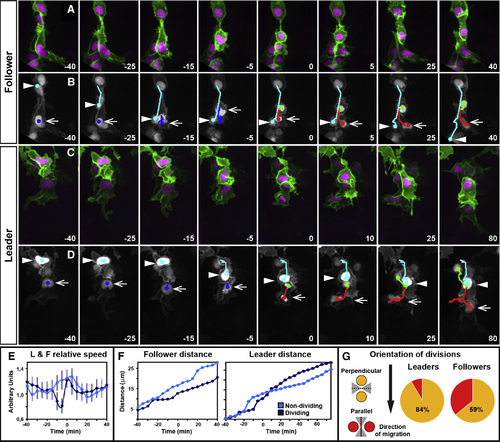
Trunk Leader and Follower Cells Present Different Division Dynamics L = 12 and F = 36 from 6 embryos, were analyzed Time in minutes and t0 = first frame with two separated nuclei. Lateral view and anterior to the left. The error bars represent SEM. (A and B) Selected frames of a dividing follower cell (Movie S7) (B) and its nuclear tracks, arrow points to dividing follower cell from -40 to 0 thereafter to its front daughter. The arrowhead points to a non-dividing neighbor. (C and D) Selected frames of a dividing leader cell (Movie S7) and (D) its nuclear tracks, the arrow marks dividing leader from -40 to 0 thereafter to its front daughter. The arrowhead marks a non-dividing neighbor. (E) Average speed ratio (speed at tn/average speed), error bars represent SEM. 17 dividing and 20 non-dividing cells, from six embryos, were analyzed. (F) Left, cumulative distance covered by a representative dividing follower and its non-dividing neighbor. The cumulative distance covered by a representative dividing-leader and its non-dividing follower is shown on the right. (G) Planes of division categorized as parallel (red) or perpendicular (yellow) relative to the direction of migration (arrow) within 45 degrees (gray shade). See also Movie S7. |
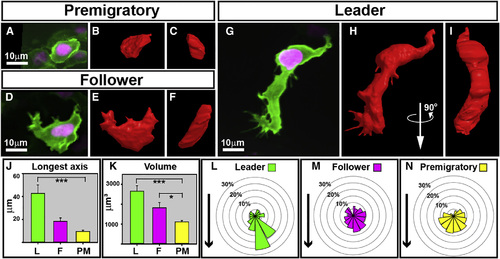
TNC Cells Show Different Morphology (A-I) 3D models of PM (A-C), F (D-F), and L (G-I) cells. Picture of the modeled cell (A-I), lateral (B, E, and H), and 90° rotation (C, F, and I) of the 3D model. (J and K) Mean longest axes and (K) mean volumes of L (n = 7), F (n = 10), and PM (n = 9), error bars represent SEM. (L-N) Angle of protrusions of L (n = 12, 217 protrusion), F (n = 24, 308 protrusion), and PM (n = 9, 141 protrusions) cells. The arrow shows the direction used to orient cells. See also Movie S10. |
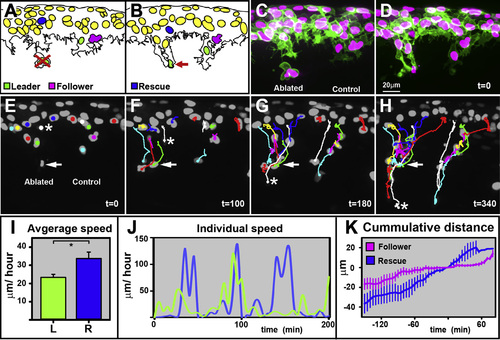
TNC Leader Cells Are Required for Migration Lateral view and anterior to the left. The error bars represent SEM. (A and B) Diagram of pre and postleader ablation. The red cross shows the targeted cell, and the red arrow shows the cell debris. (C and D) Pre and postablation snapshots. (E-H) Selected frames of a leader ablation movie, the second example in Movie S11. Asterisk mark rescuing cell. Arrow mark point of ablation. (I) Average speed of L (green, n = 15) and rescuing cells (blue, n = 4). (J) Speed of representative L and rescuing cells over time. (K) Cumulative distance covered by F (magenta, n = 4, and 3 embryos) and rescuing (blue, n = 5, and 5 embryos) cells (t0 time at which a cell overcomes the ablation point) ( 0 µm location of ablated cell) (total of eight experiments). See also Movie S11. |
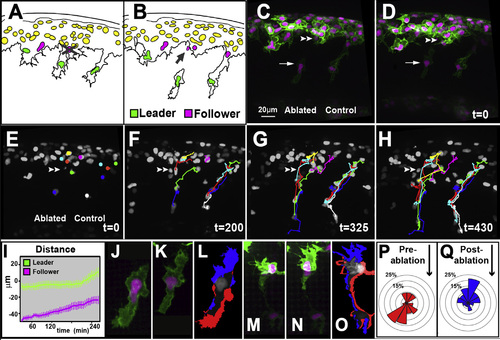
Cell-cell Contact Is Required for TNC Migration Lateral view and anterior to the left. The error bars represent SEM. (A and B) Diagram of pre- (A) and postgap (B) ablation. The gray cross shows the targeted cell, and the gray arrow shows the cell debris. (C and D) Pre- (C) and post- (D) ablation snapshots. The arrow points to the leader cell and the double arrowhead to the point of ablation. (E-H) Selected frames of a gap ablation movie, first example in Movie S12. (I) Cumulative distance covered by cells in front (green, n = 6, and 4 embryos) and behind (magenta, n = 4, and 4 embryos) the ablation (t0 time of ablation) (0 µm L location in the ablated chain) (total of seven experiments). (J-O) Enlargement of leader cell (J-L) or leader cell group (M-O) before and after a gap ablation. (L and O) Localization of the membrane extension (blue) and retraction (red) of the leader cells/group after the ablation. (P and Q) Quantification of the angle distribution of leader cells’ protrusions before (J, n = 4 cells, 54 protrusion, and 4 embryos) and after (K, n = 5 cells, 76 protrusion, and 5 embryos) ablation, the black arrow shows the direction to which all cells were oriented. See also Movie S12. |
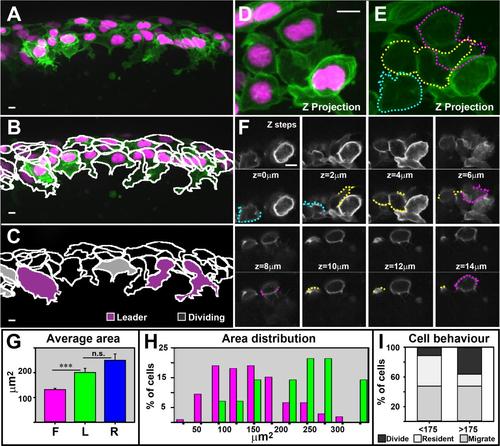
Leader and follower cells present characteristic morphologies before the initiation of migration.
(A) Picture of representative embryo premigratory area before the initiation of migration, (B) with cell outlines and (C) with leaders in purple and cell that divide within 90′ in grey (excluded from analysis). (D-F) Example of the manner in which cell outline was defined. Magnification bar 10µm. (D) Magnified picture of representative embryo premigratory area before the initiation of migration, (E) with cell outlines and (F) zplanes corresponding to the image. Top panel shows the membrane fluorescence image, bottom panel the outline of the membrane draw for each picture, that were all combined in E. Magnification bar 5µm. (G) Average areas of follower and leader cells are significantly different. Leader and rescuing cells area are not significantly different. (H) Area distribution of premigratory cells. (I) Behavior of small >175µm or big <175µm cells after leaders have initiated their migration. Half of the big or small cells migrate as followers. From the cells that remain premigratory big cells tend to divide more that small cells. n numbers F=105, L=14, 6 embryos. Error bars SEM. Lateral views, anterior left, dorsal top. All error bars 10. See also Movies S5. |