
Fig. 7
- ID
- ZDB-FIG-160701-8
- Publication
- Richardson et al., 2016 - Leader Cells Define Directionality of Trunk, but Not Cranial, Neural Crest Cell Migration
- Other Figures
- All Figure Page
- Back to All Figure Page
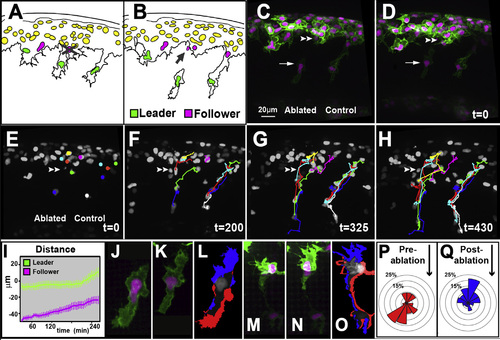
Cell-cell Contact Is Required for TNC Migration Lateral view and anterior to the left. The error bars represent SEM. (A and B) Diagram of pre- (A) and postgap (B) ablation. The gray cross shows the targeted cell, and the gray arrow shows the cell debris. (C and D) Pre- (C) and post- (D) ablation snapshots. The arrow points to the leader cell and the double arrowhead to the point of ablation. (E-H) Selected frames of a gap ablation movie, first example in Movie S12. (I) Cumulative distance covered by cells in front (green, n = 6, and 4 embryos) and behind (magenta, n = 4, and 4 embryos) the ablation (t0 time of ablation) (0 µm L location in the ablated chain) (total of seven experiments). (J-O) Enlargement of leader cell (J-L) or leader cell group (M-O) before and after a gap ablation. (L and O) Localization of the membrane extension (blue) and retraction (red) of the leader cells/group after the ablation. (P and Q) Quantification of the angle distribution of leader cells’ protrusions before (J, n = 4 cells, 54 protrusion, and 4 embryos) and after (K, n = 5 cells, 76 protrusion, and 5 embryos) ablation, the black arrow shows the direction to which all cells were oriented. See also Movie S12. |