
Fig. 6
- ID
- ZDB-FIG-160701-7
- Publication
- Richardson et al., 2016 - Leader Cells Define Directionality of Trunk, but Not Cranial, Neural Crest Cell Migration
- Other Figures
- All Figure Page
- Back to All Figure Page
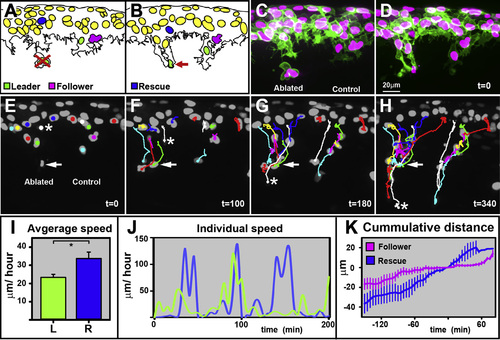
TNC Leader Cells Are Required for Migration Lateral view and anterior to the left. The error bars represent SEM. (A and B) Diagram of pre and postleader ablation. The red cross shows the targeted cell, and the red arrow shows the cell debris. (C and D) Pre and postablation snapshots. (E-H) Selected frames of a leader ablation movie, the second example in Movie S11. Asterisk mark rescuing cell. Arrow mark point of ablation. (I) Average speed of L (green, n = 15) and rescuing cells (blue, n = 4). (J) Speed of representative L and rescuing cells over time. (K) Cumulative distance covered by F (magenta, n = 4, and 3 embryos) and rescuing (blue, n = 5, and 5 embryos) cells (t0 time at which a cell overcomes the ablation point) ( 0 µm location of ablated cell) (total of eight experiments). See also Movie S11. |