
Fig. 4
- ID
- ZDB-FIG-160701-5
- Publication
- Richardson et al., 2016 - Leader Cells Define Directionality of Trunk, but Not Cranial, Neural Crest Cell Migration
- Other Figures
- All Figure Page
- Back to All Figure Page
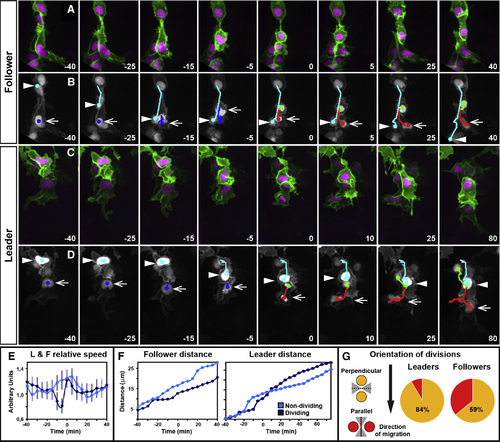
Trunk Leader and Follower Cells Present Different Division Dynamics L = 12 and F = 36 from 6 embryos, were analyzed Time in minutes and t0 = first frame with two separated nuclei. Lateral view and anterior to the left. The error bars represent SEM. (A and B) Selected frames of a dividing follower cell (Movie S7) (B) and its nuclear tracks, arrow points to dividing follower cell from -40 to 0 thereafter to its front daughter. The arrowhead points to a non-dividing neighbor. (C and D) Selected frames of a dividing leader cell (Movie S7) and (D) its nuclear tracks, the arrow marks dividing leader from -40 to 0 thereafter to its front daughter. The arrowhead marks a non-dividing neighbor. (E) Average speed ratio (speed at tn/average speed), error bars represent SEM. 17 dividing and 20 non-dividing cells, from six embryos, were analyzed. (F) Left, cumulative distance covered by a representative dividing follower and its non-dividing neighbor. The cumulative distance covered by a representative dividing-leader and its non-dividing follower is shown on the right. (G) Planes of division categorized as parallel (red) or perpendicular (yellow) relative to the direction of migration (arrow) within 45 degrees (gray shade). See also Movie S7. |