
|
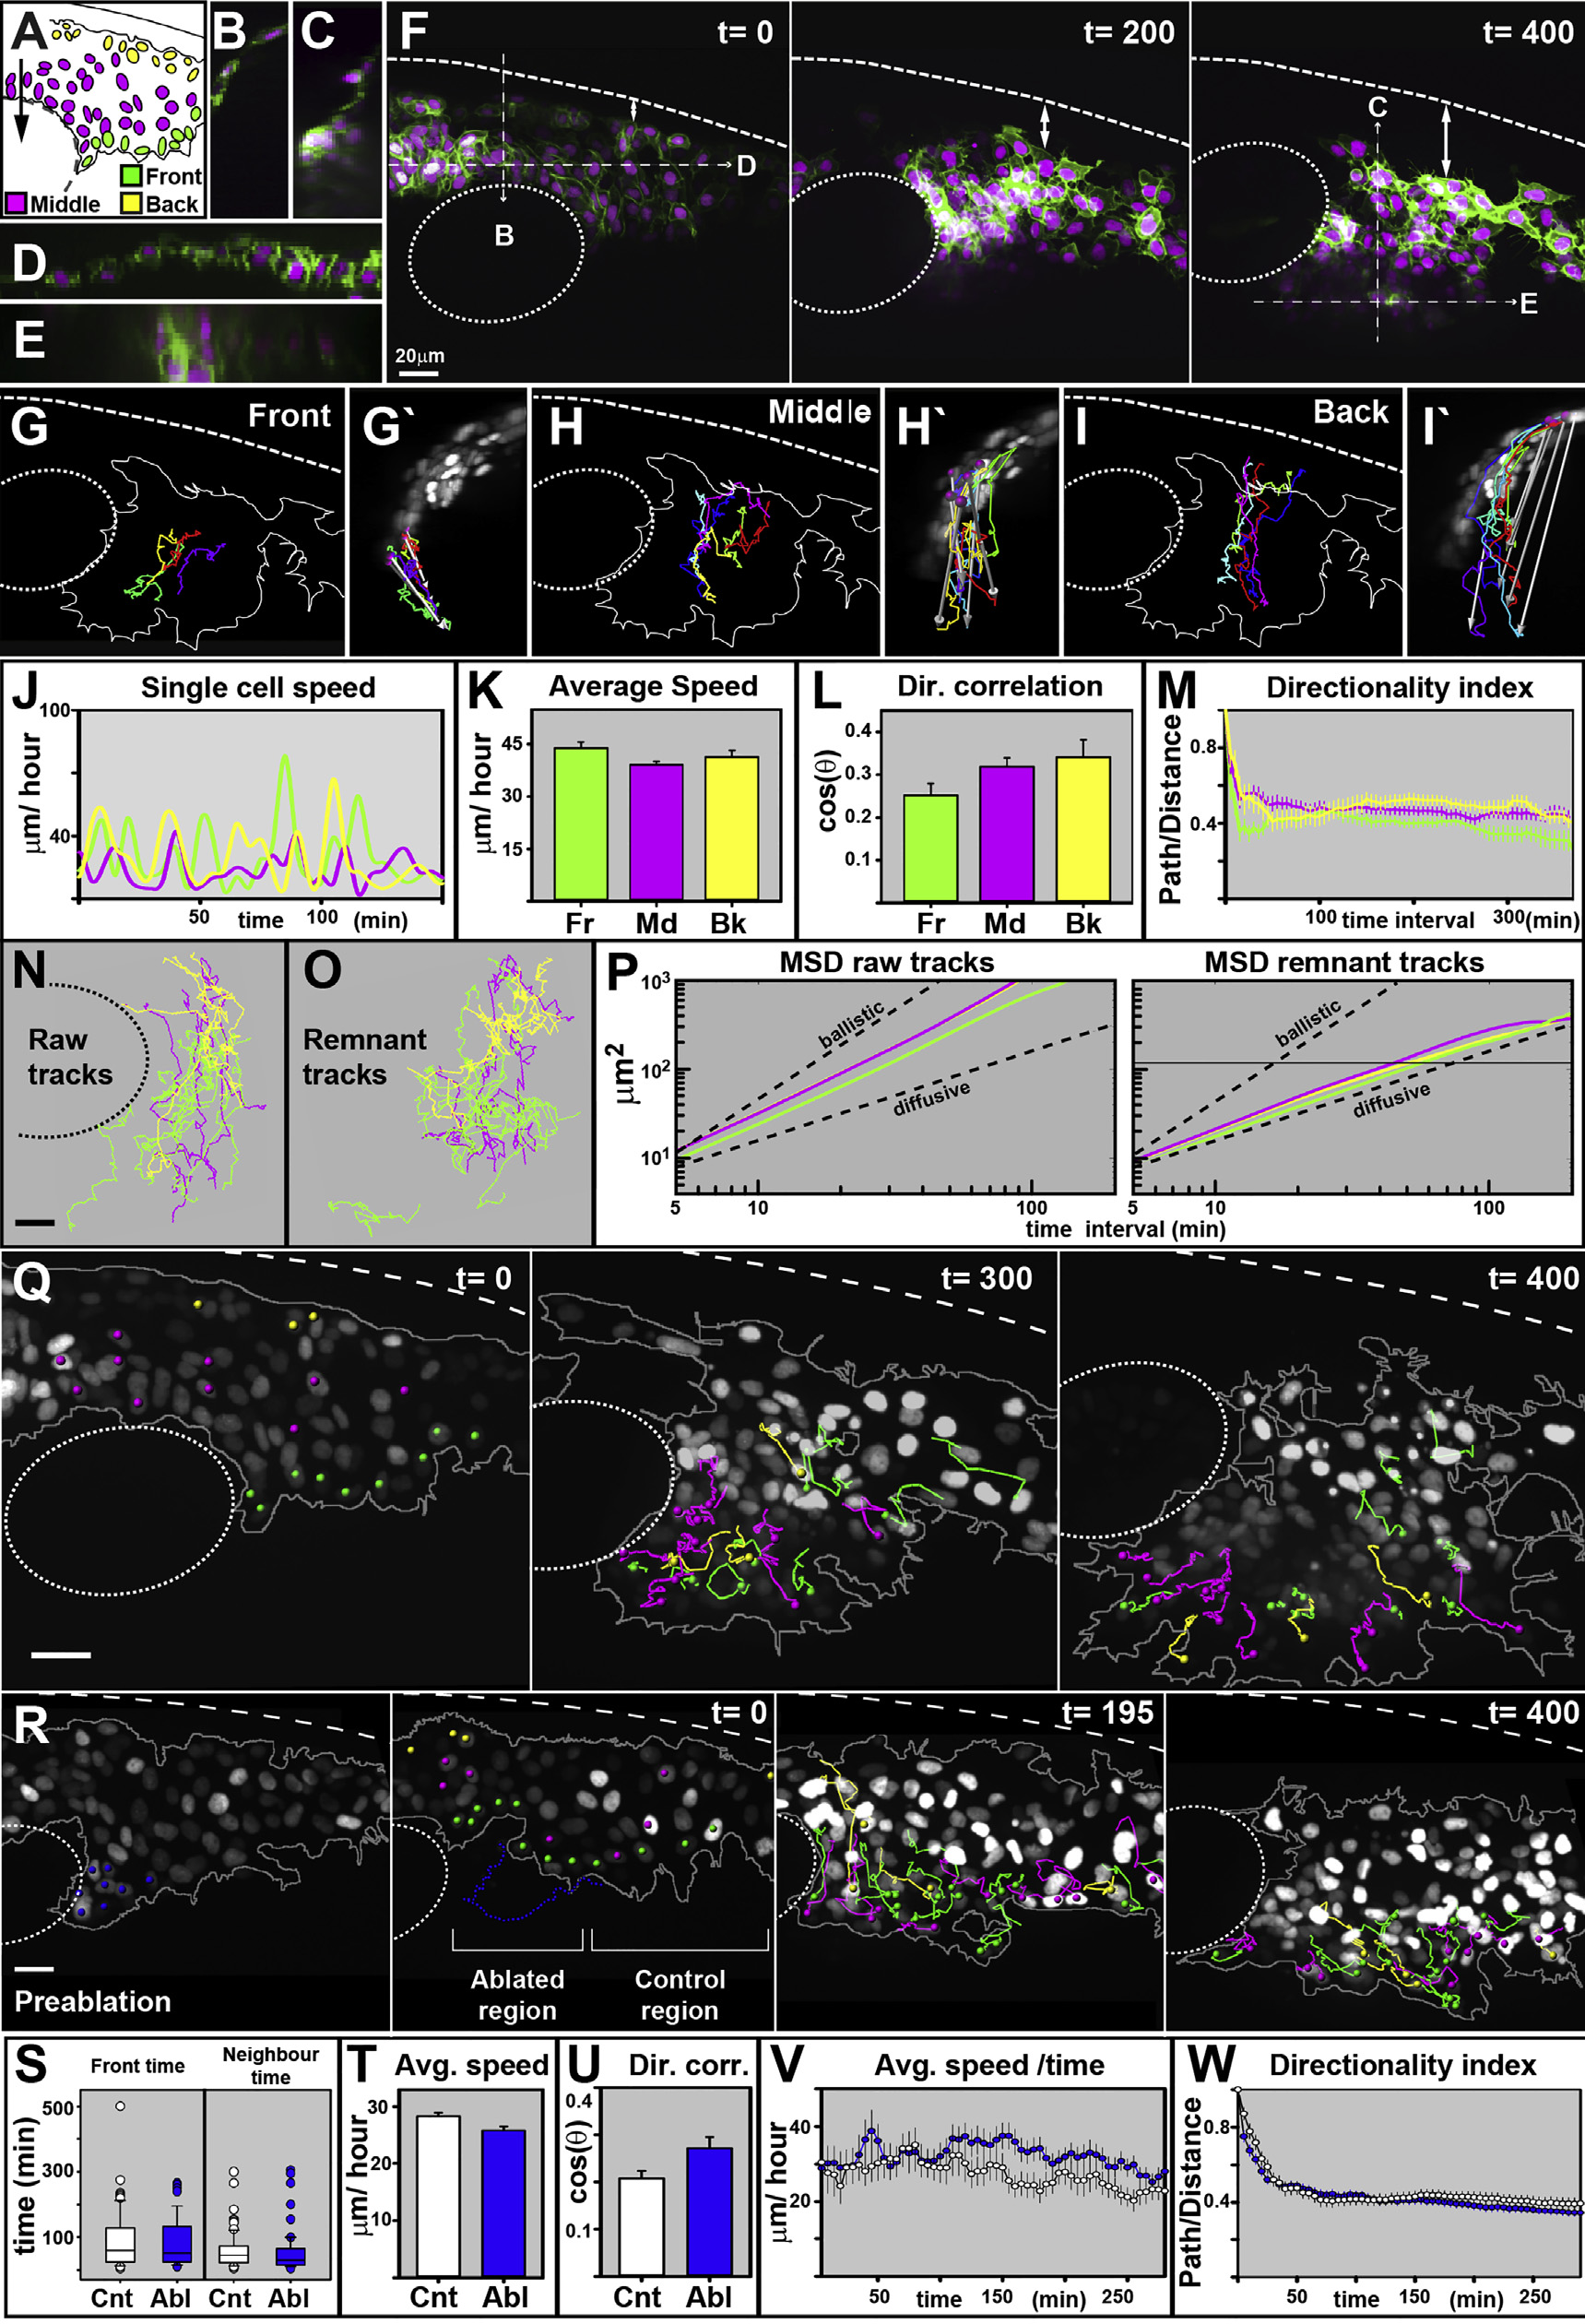
Fig. 2
CNC Migration Does Not Require Leader Cells
Time in minutes. OV: otic vesicle. Lateral views and anterior to the right. The error bars represent SEM.
(A) Diagram of CNC cells anterior to the otic vesicle. The arrow shows the directional correlation vector.
(B-E) Transverse (B and C) and coronal sections (D and E) indicated in (F).
(F) Selected frames of Movie S2. The double arrow shows the growing dorsal area void of CNC cells.
(G-I′) Tracks of representative front (Fr; G and G′), middle (Md; H and H′), and back (Bk; I and I′) cells.
Lateral (G-I′) and transversal (G′, H′, and I′) view. The grey arrows connect the initial to the final track point, showing the deviation produced by 2D tracking.
(J) Speed of representative cells over time.
(K) Average cell speed.
(L) Directional correlation.
(M) Directionality index.
(N and O) Cell tracks of raw (N) and remnant (O) movement.
(P) MSD of raw and remnant trajectories. The dashed lines show the ballistic and diffusive curves. The solid black line marks the average cell size. A logarithmic scale is used in X and Y. Front, Fr = 38, middle, Md = 39, and back, Bk = 24 cells were analyzed from 4 embryos.
(Q) Tracks of cells that initiate migration at the front of the group (green) and cells that finalize migration at the front of the group. Selected frames of Movie S3.
(R) Preablation frame. The ablated nuclei are marked in blue. Selected frames of Movie S4. The color green shows the nuclei at the front, the color magenta shows them at the middle, and the color yellow shows them at the back after ablation. The dashed blue line shows the position of themembrane before ablation.
(S-W) A comparison between control (white) and ablated cells (blue) of time at the front of the group and of neighboring nuclei (S), average speed (T), directional correlation (U), average speed over time (V), and directionality ratio (W). A total of 30 and 33 cells from ablated and non-ablated regions, from 3 embryos, were analyzed.
All scale bars = 20 µm.
See also Movies S2, S3, and S4.