
|
Fig. 3
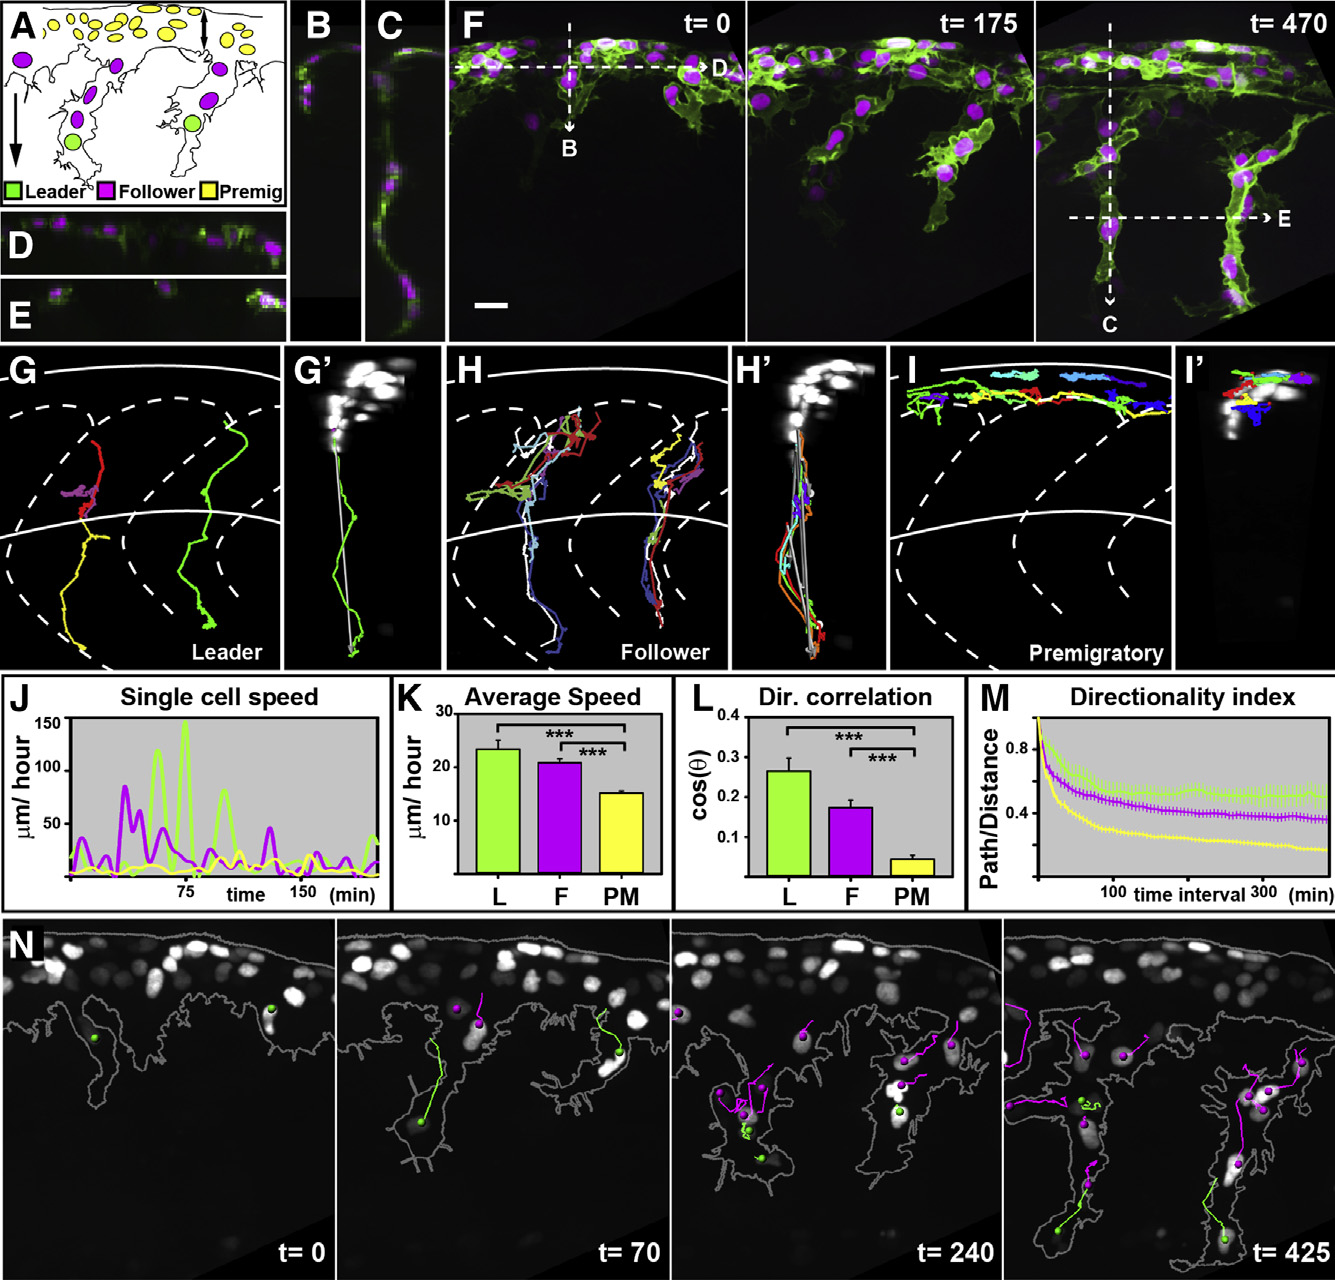
TNC Are Formed of Three Different Cell Populations
Time in minutes. Lateral view and anterior to the left. The error bars represent SEM.
(A) Diagram of migrating TNC cell leader, L, green; follower, F, magenta; and premigratory, PM, yellow. The double arrow marks the premigratory area. The simple arrow shows the directional correlation vector.
(B-E) Transversal (B and C) and coronal (D and E) optical sections indicated in (F).
(F) Representative frames of migrating TNC cell (Movie S5).
(G-I′) Tracks of representative L (G and G′), F (H and H′), and PM (I and I′) cells. Lateral (G, H, and I) and transversal (G′, H′, and I′) views.
(J) Speed of representative cells over time.
(K) Average cell speed.
(L) Directional correlation.
(M) Directionality index (L = 15, F = 83, and PM = 85 cells, from 6 embryos, were analyzed).
(N) Representative frames of migrating TNC cell (Movie S8) showing the tracks of L and F cells.
All scale bars = 20 µm, valid for all panels.
See also Movies S5, S6, S8, and S9.