
- Title
-
Zebrafish biosensor for toxicant induced muscle hyperactivity
- Authors
- Shahid, M., Takamiya, M., Stegmaier, J., Middel, V., Gradl, M., Klüver, N., Mikut, R., Dickmeis, T., Scholz, S., Rastegar, S., Yang, L., Strähle, U.
- Source
- Full text @ Sci. Rep.

Zebrafish hspb11 BAC transgenic line recapitulates the endogenous gene expression. Expression of the hspb11 transgene (GFP, green) at 24 hpf (A-A′), 48 hpf (B-B′) and 5 dpf (C-C′). Lateral views are shown with the anterior end oriented to the left. Insets (a-c) show optical transverse sections, dorsal side up. Fluorescence channel image of the hspb11 reporter (A-C) is merged with the respective bright field transmission images (A′-C′). (A-A′) hspb11 transgenic embryos at 24 hpf show GFP reporter expression in the muscle cells (big arrow) in a layer of slow muscles (inset a, small arrow). A stippled circle in the inset (a) represents the notochord. (B-B′) At 48 hpf, stronger GFP expression appears in the notochord (nc, also inset b dotted circle) and in the slow muscle cells (sm; a small arrow in the inset b). (C-C′) At 5 dpf the GFP expression in slow muscle cells (sm) and notochord (nc) persists, with additional expressions in the heart (h), eye muscles (em), pectoral fins (pf), jaw muscles (jm) and weakly in the fast muscles (c, arrowhead). (D-G) In situ gene expression analysis of hspb11 at 24 (D) and 48 hpf (E-G) in wildtype embryos. At 24 hpf, hspb11 expression appears in the muscle pioneer cells (D, white arrow), and it is further expressed in the slow muscles at 48 hpf (F, sm). (E) At 48 hpf hspb11 expression is also seen in the muscle of the eye (em), the jaw muscles (jm) and in the heart (h). (G) hspb11 expression is visible in the notochord at 48 hpf. Scale bar: (A-C′) 200 µm, (D-G) 100 µm. |
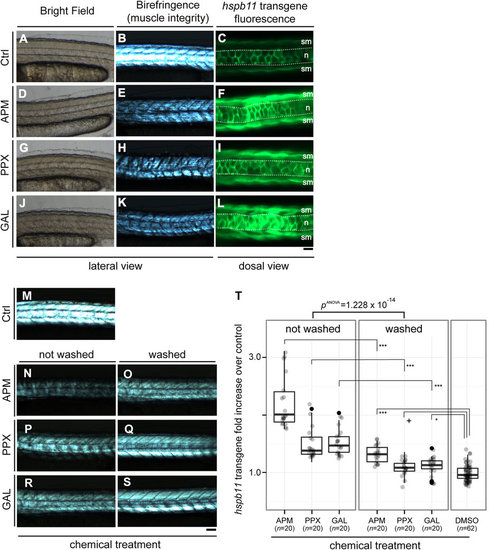
The hspb11 transgene responses to pesticides. Embryos from TgBAC(hspb11:GFP) were treated with either DMSO (solvent control; A-C and M), or the pesticides azinphosmethyl (APM; D-F), propoxur (PPX; G-I) or galanthamine (GAL; J-L). The embryos were treated from 90%-epiboly (9 hpf) to 48 hpf and examined for birefringence as a readout of muscle integrity (B,E,H,K; lateral view of the trunk region) and hspb11 transgene expression (C,F,I,L; dorsal view of the trunk region). Corresponding bright field images are given in (A,D,G,J; lateral view). The stippled lines (in C,F,I,L) delineate the notochord (n). sm: slow muscle. Anterior left. (M-S) Embryos from TgBAC(hspb11:GFP) were treated with either azinphosmethyl (N,O), propoxur (P,Q) or galanthamine (R,S). The hspb11 transgene level was compared between two groups: one group treated with chemicals from 9-48 hpf (“not washed”; M,N,P,R), another treated from 9-24 hpf, followed by several washes in fresh fish water until 48 hpf (“washed”; O,Q,S). The intensity of hspb11 transgene is expressed in fold increase over control. Scale bars: (A,B,D,E,G,H,J,K,M-S) 100 µm; (C,F,I,L) 50 µm. (T) Quantification of the experiments exemplified in (M-S). The intensity of hspb11 transgene expression is shown as fold induction over DMSO control. There were significant effects of the washout of the compounds on the hspb11 transgene level (one-way ANOVA, F[1, 118] = 77.762, p = 1.228 × 10⁻¹⁴), with azinphosmethyl (TukeyHSD test from here onward, p = 0.0000000), propoxur (p = 0.0000429), and galanthamine (p = 0.0000087) treated embryos now showing lower hspb11 transgene expression. However, all washed groups showed still higher hspb11 transgene levels in comparison to DMSO solvent control (one-way ANOVA, F[3, 118] = 29.316, p = 3.09 × 10⁻¹⁴; TukeyHSD test, ***p = 0.0000000 for azinphosmethyl vs. control, p = 0.0507833+ with a substantial difference for propoxur vs. control, and *p = 0.0124261 for galanthamine vs. control). |

Reduced muscle integrity in correlation to hspb11 transgene up-regulation. Birefringence images from the trunk region of wildtype embryos, treated during 9-48 hpf with either azinphosmethyl (A, 3 µM), propoxur (B, 720 µM), galanthamine (C, 1 mM), chlorpyrifos (D, 20 µM), dibutylphthalate (E, 2.69 µM), veratridine (F, 120 µM), methylmercury (G, 0.119 µM), methoxychlor (H, 2.3 µM), esfenvalerate (I, 0.191 µM), flucythrinate (J, 0.055 µM), chlorophenol (K, 389 µM), dibromoethane (L, 2.1 mM), dimethylphenol (M, 327 µM) and chlorothalonil (N, 0.4 µM). Five representative examples are shown for each chemical. Scale bar: 500 µm. |
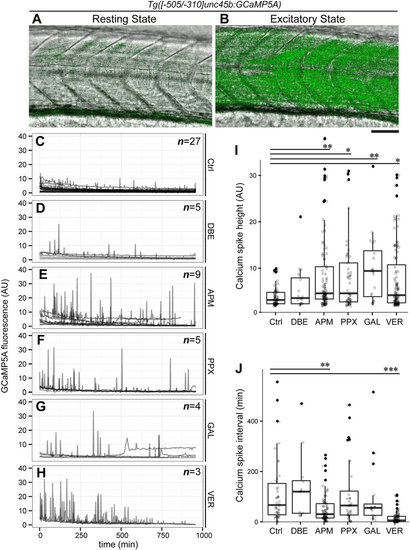
Up-regulation of hspb11 transgene accompanies muscle hyperactivity. (A,B) Lateral views of the trunk region of a muscle-specific calcium sensor line Tg([-505/-310]unc45b:GCaMP5A) at 72 hpf. The fluorescent channel images for calcium (green) are merged with the bright field transmission images (gray) for non-contractile resting state (A) and excitatory state (B), exhibiting low and high fluorescent reporter levels, respectively. Anterior side is oriented to the left. Scale bar: 50 µm. (C-H) Profiles of calcium levels in the trunk skeletal muscle from individual embryos treated with either DMSO solvent control (Ctrl, C), dibromoethane (DBE, D), azinphosmethyl (APM, E), propoxur (PPX, F), galanthamine (GAL, G) or veratridine (VER, H) plotted as a function of time (temporal resolution: 2.5 minutes). The number of examined embryos is shown at the top-right of each panel. (I-J) Calcium profiles shown in the panels (C-H) were analyzed for the height of individual calcium spikes (I) and the temporal interval of two adjacent calcium spikes (J) and presented in whisker-box charts with individual data shown as gray dots. Black dots represent outliers. (I) One-way ANOVA showed significant differences of calcium spike height (F[5,315] = 4.1464, p = 0.00116) between solvent control (n = 55 spikes), dibromoethane (n = 16 spikes), azinphosmethyl (n = 89 spikes), propoxur (n = 45 spikes), galanthamine (n = 20 spikes), veratridine (n = 96 spikes). Significant differences over the solvent control were found with azinphosmethyl (TukeyHSD test from here onward, **p = 0.002698), propoxur (*p = 0.01845), galanthamine (**p = 0.009827) and veratridine (*p = 0.01391) treatments, while dibromoethane showed no difference over the control treatment (p = 0.9317). (J) Significant differences of calcium spike intervals were detected (one-way ANOVA, F[5,256] = 12.422, p = 8.405 × 10⁻¹¹) between solvent control (n = 42 intervals), dibromoethane (n = 12 intervals), azinphosmethyl (n = 75 intervals), propoxur (n = 34 intervals), galanthamine (n = 16 intervals), veratridine (n = 83 intervals). Azinphosmethyl (TukeyHSD test from here onward, **p = 0.003285) and veratridine (***p = 1.0 × 10⁻⁷) treatments significantly shortened the interval of calcium spikes, while dibromoethane (p = 0.9744) galanthamine (p = 0.9895) and propoxur (p = 0.9999) were comparable with the control treatment. |
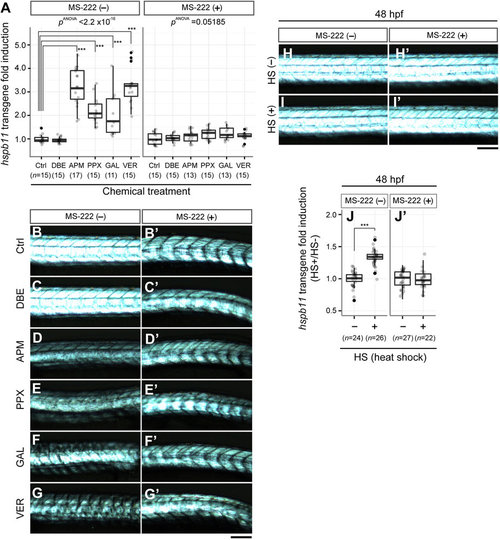
Chemical-or heat shock-induced up-regulation of hspb11 transgene expression is caused by muscle hyperactivity. (A) Chemical induction of hspb11 transgene expression. TgBAC(hspb11:GFP) embryos were treated with azinphosmethyl (APM), propoxur (PPX), galanthamine (GAL) or veratridine (VER) during 9-48 hpf with negative controls of DMSO control (Ctrl) and dibromoethane (DBE), either in the absence or in the presence of MS-222. The hspb11 GFP reporter intensity in the trunk region is expressed as fold induction over DMSO control. In the absence of MS-222, a significant increase of hspb11 transgene expression in comparison to the DMSO control was observed (one-way ANOVA F[5, 82] = 40.732, p = 2.2 × 10⁻¹⁶) with azinphosmethyl (TukeyHSD, ***p = 0.0000000), propoxur (***p = 0.0000165), galanthamine (***p = 0.0007428), and veratridine (***p = 0.0000000). However, this was not the case in the presence of MS-222 (F[5, 80] = 2.3075, p = 0.05185). Sample size is given in parenthesis as the number of embryos. (B-G′) Birefringence images of representative embryos from the experiment shown in panel (A) (lateral views, anterior left). (H-I′) Birefringence images of representative embryos from the experiment quantified in (J,J′) at 48 hpf treated with a heat shock (HS) of 1 hour at 37 °C in the absence (J) or the presence (J′) of MS-222. (J-J′) HS-mediated up-regulation of hspb11 transgene expression. TgBAC(hspb11:GFP) embryos at 48 hpf were treated either with HS (37 °C, 1 hour) or left untreated, and HS effects on hspb11 transgene expression were evaluated either in the absence or in the presence of MS-222. In the absence of MS-222, HS induced a significant increase of hspb11 transgene expression (Welch two-sample t-test; t = -11.2483, ***p = 1.036 × 10⁻¹⁴). In contrast, no significant increase was observed in the presence of MS-222 (Welch two-sample t-test; t = 0.3744, p = 0.7098). Sample size is given in parenthesis as the number of embryos. Scale bars: 200 µm. |