
|
Fig. 1
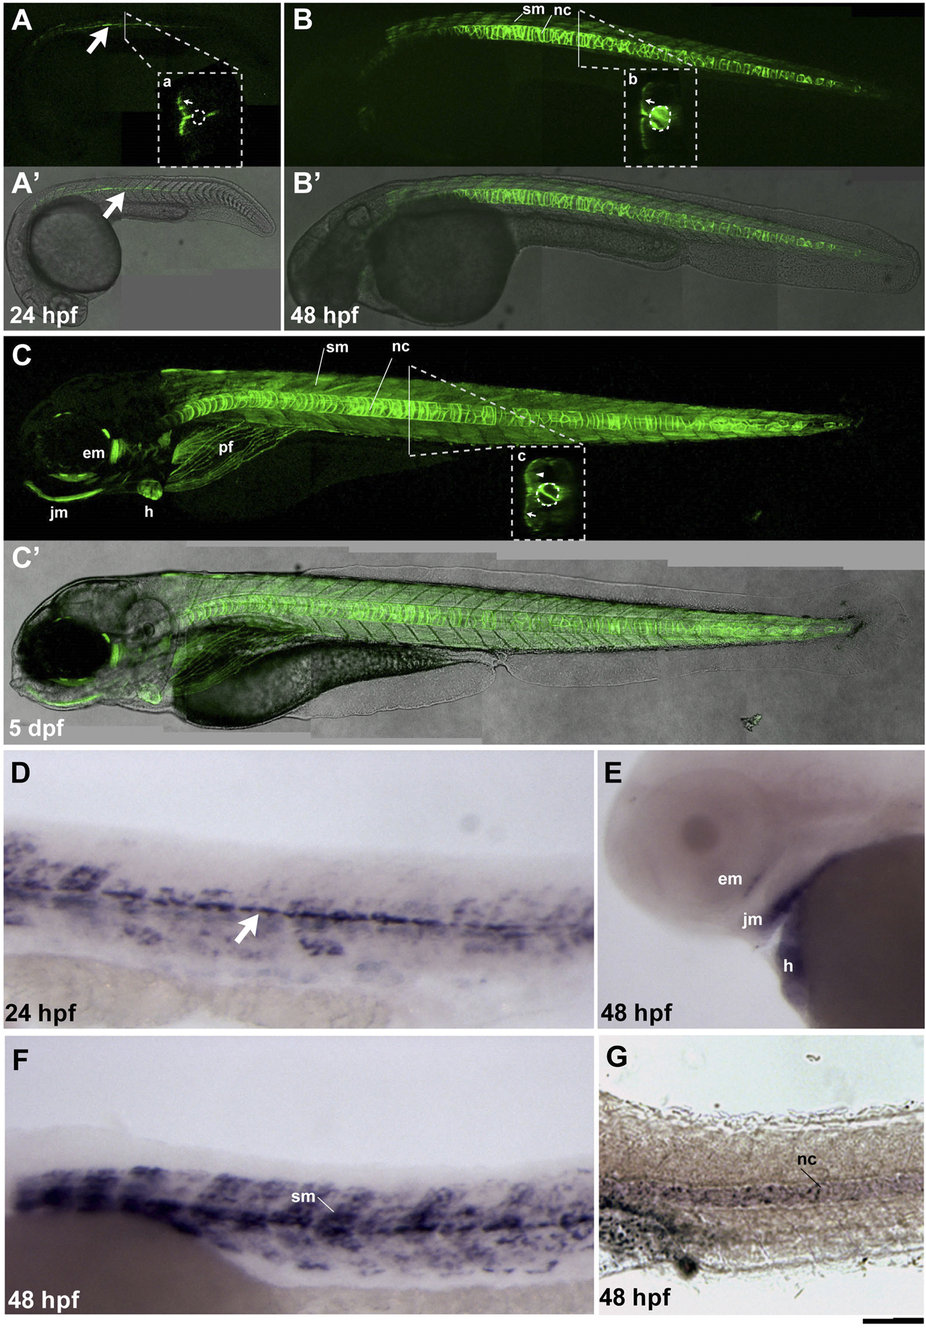
Zebrafish hspb11 BAC transgenic line recapitulates the endogenous gene expression.
Expression of the hspb11 transgene (GFP, green) at 24 hpf (A-A′), 48 hpf (B-B′) and 5 dpf (C-C′). Lateral views are shown with the anterior end oriented to the left. Insets (a-c) show optical transverse sections, dorsal side up. Fluorescence channel image of the hspb11 reporter (A-C) is merged with the respective bright field transmission images (A′-C′). (A-A′) hspb11 transgenic embryos at 24 hpf show GFP reporter expression in the muscle cells (big arrow) in a layer of slow muscles (inset a, small arrow). A stippled circle in the inset (a) represents the notochord. (B-B′) At 48 hpf, stronger GFP expression appears in the notochord (nc, also inset b dotted circle) and in the slow muscle cells (sm; a small arrow in the inset b). (C-C′) At 5 dpf the GFP expression in slow muscle cells (sm) and notochord (nc) persists, with additional expressions in the heart (h), eye muscles (em), pectoral fins (pf), jaw muscles (jm) and weakly in the fast muscles (c, arrowhead). (D-G) In situ gene expression analysis of hspb11 at 24 (D) and 48 hpf (E-G) in wildtype embryos. At 24 hpf, hspb11 expression appears in the muscle pioneer cells (D, white arrow), and it is further expressed in the slow muscles at 48 hpf (F, sm). (E) At 48 hpf hspb11 expression is also seen in the muscle of the eye (em), the jaw muscles (jm) and in the heart (h). (G) hspb11 expression is visible in the notochord at 48 hpf. Scale bar: (A-C′) 200 µm, (D-G) 100 µm.