
Fig. 6
- ID
- ZDB-FIG-160428-5
- Publication
- Shahid et al., 2016 - Zebrafish biosensor for toxicant induced muscle hyperactivity
- Other Figures
- All Figure Page
- Back to All Figure Page
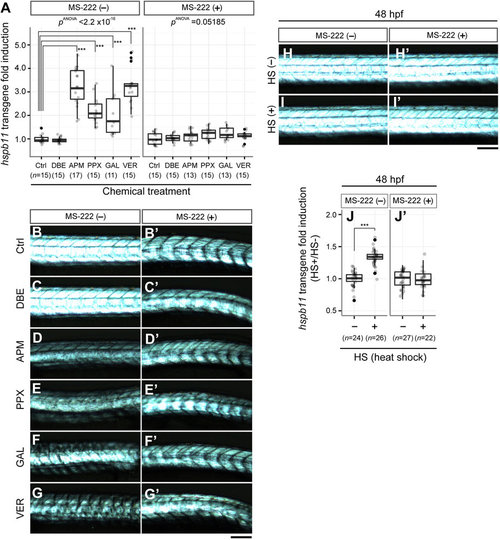
Chemical-or heat shock-induced up-regulation of hspb11 transgene expression is caused by muscle hyperactivity. (A) Chemical induction of hspb11 transgene expression. TgBAC(hspb11:GFP) embryos were treated with azinphosmethyl (APM), propoxur (PPX), galanthamine (GAL) or veratridine (VER) during 9-48 hpf with negative controls of DMSO control (Ctrl) and dibromoethane (DBE), either in the absence or in the presence of MS-222. The hspb11 GFP reporter intensity in the trunk region is expressed as fold induction over DMSO control. In the absence of MS-222, a significant increase of hspb11 transgene expression in comparison to the DMSO control was observed (one-way ANOVA F[5, 82] = 40.732, p = 2.2 × 10⁻¹⁶) with azinphosmethyl (TukeyHSD, ***p = 0.0000000), propoxur (***p = 0.0000165), galanthamine (***p = 0.0007428), and veratridine (***p = 0.0000000). However, this was not the case in the presence of MS-222 (F[5, 80] = 2.3075, p = 0.05185). Sample size is given in parenthesis as the number of embryos. (B-G′) Birefringence images of representative embryos from the experiment shown in panel (A) (lateral views, anterior left). (H-I′) Birefringence images of representative embryos from the experiment quantified in (J,J′) at 48 hpf treated with a heat shock (HS) of 1 hour at 37 °C in the absence (J) or the presence (J′) of MS-222. (J-J′) HS-mediated up-regulation of hspb11 transgene expression. TgBAC(hspb11:GFP) embryos at 48 hpf were treated either with HS (37 °C, 1 hour) or left untreated, and HS effects on hspb11 transgene expression were evaluated either in the absence or in the presence of MS-222. In the absence of MS-222, HS induced a significant increase of hspb11 transgene expression (Welch two-sample t-test; t = -11.2483, ***p = 1.036 × 10⁻¹⁴). In contrast, no significant increase was observed in the presence of MS-222 (Welch two-sample t-test; t = 0.3744, p = 0.7098). Sample size is given in parenthesis as the number of embryos. Scale bars: 200 µm. |