
|
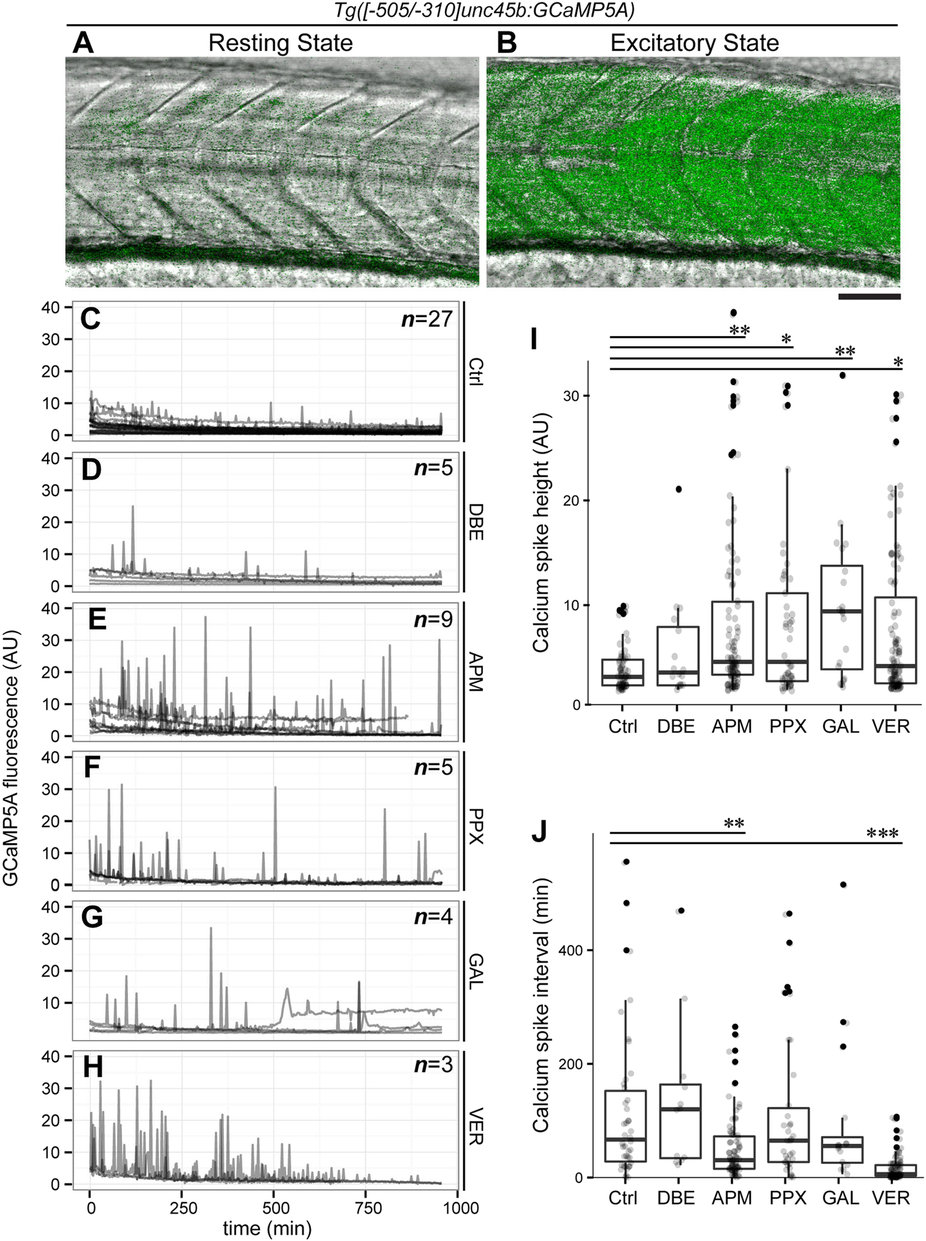
Fig. 5
Up-regulation of hspb11 transgene accompanies muscle hyperactivity.
(A,B) Lateral views of the trunk region of a muscle-specific calcium sensor line Tg([-505/-310]unc45b:GCaMP5A) at 72 hpf. The fluorescent channel images for calcium (green) are merged with the bright field transmission images (gray) for non-contractile resting state (A) and excitatory state (B), exhibiting low and high fluorescent reporter levels, respectively. Anterior side is oriented to the left. Scale bar: 50 µm. (C-H) Profiles of calcium levels in the trunk skeletal muscle from individual embryos treated with either DMSO solvent control (Ctrl, C), dibromoethane (DBE, D), azinphosmethyl (APM, E), propoxur (PPX, F), galanthamine (GAL, G) or veratridine (VER, H) plotted as a function of time (temporal resolution: 2.5 minutes). The number of examined embryos is shown at the top-right of each panel. (I-J) Calcium profiles shown in the panels (C-H) were analyzed for the height of individual calcium spikes (I) and the temporal interval of two adjacent calcium spikes (J) and presented in whisker-box charts with individual data shown as gray dots. Black dots represent outliers. (I) One-way ANOVA showed significant differences of calcium spike height (F[5,315] = 4.1464, p = 0.00116) between solvent control (n = 55 spikes), dibromoethane (n = 16 spikes), azinphosmethyl (n = 89 spikes), propoxur (n = 45 spikes), galanthamine (n = 20 spikes), veratridine (n = 96 spikes). Significant differences over the solvent control were found with azinphosmethyl (TukeyHSD test from here onward, **p = 0.002698), propoxur (*p = 0.01845), galanthamine (**p = 0.009827) and veratridine (*p = 0.01391) treatments, while dibromoethane showed no difference over the control treatment (p = 0.9317). (J) Significant differences of calcium spike intervals were detected (one-way ANOVA, F[5,256] = 12.422, p = 8.405 × 10⁻¹¹) between solvent control (n = 42 intervals), dibromoethane (n = 12 intervals), azinphosmethyl (n = 75 intervals), propoxur (n = 34 intervals), galanthamine (n = 16 intervals), veratridine (n = 83 intervals). Azinphosmethyl (TukeyHSD test from here onward, **p = 0.003285) and veratridine (***p = 1.0 × 10⁻⁷) treatments significantly shortened the interval of calcium spikes, while dibromoethane (p = 0.9744) galanthamine (p = 0.9895) and propoxur (p = 0.9999) were comparable with the control treatment.