
Fig. 2
- ID
- ZDB-FIG-160428-2
- Publication
- Shahid et al., 2016 - Zebrafish biosensor for toxicant induced muscle hyperactivity
- Other Figures
- All Figure Page
- Back to All Figure Page
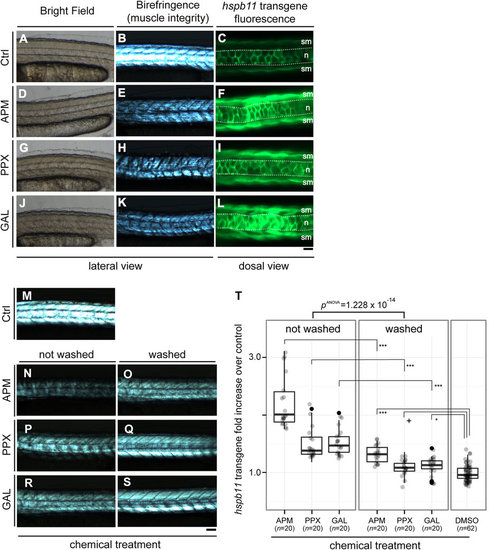
The hspb11 transgene responses to pesticides. Embryos from TgBAC(hspb11:GFP) were treated with either DMSO (solvent control; A-C and M), or the pesticides azinphosmethyl (APM; D-F), propoxur (PPX; G-I) or galanthamine (GAL; J-L). The embryos were treated from 90%-epiboly (9 hpf) to 48 hpf and examined for birefringence as a readout of muscle integrity (B,E,H,K; lateral view of the trunk region) and hspb11 transgene expression (C,F,I,L; dorsal view of the trunk region). Corresponding bright field images are given in (A,D,G,J; lateral view). The stippled lines (in C,F,I,L) delineate the notochord (n). sm: slow muscle. Anterior left. (M-S) Embryos from TgBAC(hspb11:GFP) were treated with either azinphosmethyl (N,O), propoxur (P,Q) or galanthamine (R,S). The hspb11 transgene level was compared between two groups: one group treated with chemicals from 9-48 hpf (“not washed”; M,N,P,R), another treated from 9-24 hpf, followed by several washes in fresh fish water until 48 hpf (“washed”; O,Q,S). The intensity of hspb11 transgene is expressed in fold increase over control. Scale bars: (A,B,D,E,G,H,J,K,M-S) 100 µm; (C,F,I,L) 50 µm. (T) Quantification of the experiments exemplified in (M-S). The intensity of hspb11 transgene expression is shown as fold induction over DMSO control. There were significant effects of the washout of the compounds on the hspb11 transgene level (one-way ANOVA, F[1, 118] = 77.762, p = 1.228 × 10⁻¹⁴), with azinphosmethyl (TukeyHSD test from here onward, p = 0.0000000), propoxur (p = 0.0000429), and galanthamine (p = 0.0000087) treated embryos now showing lower hspb11 transgene expression. However, all washed groups showed still higher hspb11 transgene levels in comparison to DMSO solvent control (one-way ANOVA, F[3, 118] = 29.316, p = 3.09 × 10⁻¹⁴; TukeyHSD test, ***p = 0.0000000 for azinphosmethyl vs. control, p = 0.0507833+ with a substantial difference for propoxur vs. control, and *p = 0.0124261 for galanthamine vs. control). |