- Title
-
ES1 is a mitochondrial enlarging factor contributing to form mega-mitochondria in zebrafish cones
- Authors
- Masuda, T., Wada, Y., Kawamura, S.
- Source
- Full text @ Sci. Rep.
|
(a) RT-PCR assay for ES1 gene expression in zebrafish tissues. Beta-actin was used as an internal control for a constant amount of RNA templates. i.o. internal organs, sk. muscle: skeletal muscle. (b) Immunoblot assay with ES1 antibody in zebrafish tissues. Alpha-tubulin antibody was used as a loading control. sk. muscle: skeletal muscle. (c) In situ hybridization on adult zebrafish retina. ES1 mRNA was only detected around cone nuclei (purple staining, left panel). Rhodopsin probe was used as a rod maker (right panel). Dark-brown staining in RPE (retinal pigment epithelium) layer is due to endogenous melanin pigment. Scale bars, 10 µm. (d) Immunohistochemistry on adult zebrafish retina with ES1 (green) and TOM20 (mitochondrial marker, red) antibodies. ES1-immunoreactivity was detected in ellipsoids in all types of cones (i.e., double, long-single and short-single cones, arrows) but not in rod ellipsoids (arrow heads). Scale bars, 10 µm. RE: rod ellipsoid, CE: cone ellipsoid, DC: double cone, LSC: long-single cone, SSC: short-single cone. (e-j) Immuno-gold electron microscopy with ES1 antibody on adult zebrafish retina. Each panel shows a cone ellipsoid with an outer segment (in e), a cone nucleus (in f) or a rod ellipsoid with an outer segment (in g). Panel (h-j) are magnified views of the areas surrounded by dashed lines in (e-g), respectively. A mega-mitochondrion was observed in the apical region of the cone ellipsoid (in (e) and (h), adjacent to the outer segment). Arrows indicate gold particles in (h). Scale bars, 1 µm in (e-j). COS: cone outer segment, ROS: rod outer segment. EXPRESSION / LABELING:
|
|
Knocking-down of ES1 resulted in formation of smaller mitochondria in cones.(a) Immunohistochemistry of retinal sections from ES1-MOs-injected or non-injected larvae at 4 dpf stage with both TOM20 (red) and mAAT (green) antibodies. Nuclei were stained with DAPI (blue). CE: cone ellipsoid, OPL: outer plexiform layer. (b) Immunohistochemistry with red/green opsins (cone outer segment marker, red) and mAAT (green) antibodies. The inset in each panel is a magnified view of the area surrounded by the dashed line. (c) Quantification of relative signal intensities of the mitochondrial markers from the cone ellipsoid layer of each MO-injected class; no injection (n = 28), control MO (n = 23), ES1-MO1 (n = 37) and ES1-MO2 (n = 23). Data are presented as box-whisker plots showing the median, quartiles and range. Mean value of no injection class was set to 1.0. (d) A paired RT-PCR (top) and immunohistochemical analysis (middle and bottom) in a single larva using a single eye for each analysis without (A) or with (B) the knock down effect of ES1-MO1. A completely-inhibited larva showed the relative immunopositive signal intensity of 0.20 (B), whereas a larva representing no inhibition showed 0.77 (A). (e) Representatives of electron microscopic images of cone mitochondria of control MO-injected (left panel) or ES1-MO2-injected (right panel) larvae at 4 dpf. Dashed lines outline each mitochondrion. The images without the outlines are shown in Supplementary Fig. S5. |
|
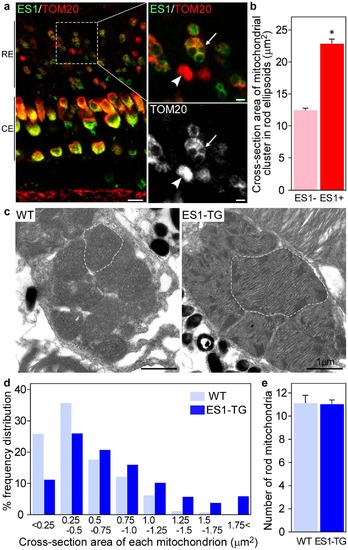
Ectopic expression of ES1 led mitochondrial enlargement in rods.(a) Immunohistochemistry of retinal sections from adult ES1-TG zebrafish (F0) with ES1 (green) and TOM20 (red) antibodies. Images are at a certain depth of confocal view. Right panels show a magnified view of merged image (upper) or TOM20 alone (lower). An arrow in each panel indicates a mitochondrial cluster in an ES1-expressing rod ellipsoid and an arrowhead indicates a mitochondrial cluster in a wild-type rod ellipsoid. As in the cone ellipsoids, immunopositive signals were weaker in the round patch in the ES1-expressing rods than the wild-type, presumably because of low antibody permeability of mega-mitochondria. Scale bars, 10 µm (left panel) and 2 µm (right panels). RE: rod ellipsoid, CE: cone ellipsoid. (b) Quantification of cross-section areas of mitochondrial clusters in rod ellipsoids. TOM20-immunopositive cross-section areas including immunonegative round areas were measured. Values are means ± S.E., *P = 2 × 1031 in Student’s t-test, n = 120 for wild-type rods (ES1-) and n = 142 for ES1-expressing rods (ES1+). (c) Representatives of electron microscopic images of mitochondria in wild-type (WT) rods (left panel) or ES1-TG rods (right panel). F1 generation of ES1-TG zebrafish, in which all rods express ES1, was used. Dashed lines outline the largest mitochondrion in each view. (d) Mitochondrial size distribution in ES1-TG and WT rods. Cross-section area of each mitochondrion was measured in the electron microscopic images. n = 256 for WT and n = 420 for ES1-TG. (e) The number of mitochondria present in each rod. Values are means ± S.E., n = 23 for WT and n = 38 for ES1-TG. |
|
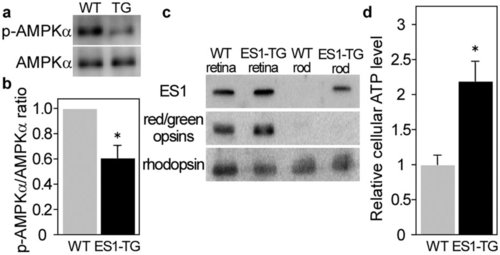
ES1-enhanced mitochondrial energy production in rods. a) A representative result of immunoblottings with antibodies against AMPKα and phospho-AMPKα for estimation of phosphorylation levels of AMPKα in rods isolated from ES1-TG or WT siblings. (b) Relative phosphorylation levels of AMPKα in isolated rods assessed by the immunoblottings. Values are means ± S.E., *P = 0.008 in Student’s t-test, n = 7 for both WT and ES1-TG. (c) Immunoblottings of both the retinas and rods isolated from ES1-TG or WT siblings with antibodies against ES1, red/green opsins or rhodopsin. (d) Relative ATP levels in an isolated rod. Values are means ± S.E., *P = 0.002 in Student’s t-test, n = 8 for both ES1-TG and WT. |
|
Subcellular localization of ES1 in zebrafish cones. (a) Apparent heterogeneity of immunoreactivities in cone ellipsoid. High magnification views of double immunostainings of cone ellipsoids with TOM20/ES1 antibodies (upper panels) and TOM20/mAAT antibodies (lower panels). TOM20 antibody was used as a mitochondrial outer membrane marker to detect the outline of individual mitochondria. Both ES1- and mAATimmunopositive signals were weaker at apical (upward direction) and central regions of the cone ellipsoids (right panels). In the same regions, TOM20 antibody depicted clear round patches >2 µm in diameter (middle panels), indicating the presence of mega-mitochondria. (b) Subcellular fractionation analysis for ES1. Immunoblotting analysis with anti-ES1 antibodies was performed using fractionated cells from retinas. Anti-alpha-tubulin and TOM20 antibodies were used as a marker for soluble fraction and membrane fraction, respectively. S: soluble fraction, M: membrane fraction. |
|
Morphology of MO-injected larvae. (a) Representative whole body images of control MO- and ES1-MO2-injected 4 dpf larvae. (b) Immunohistochemistry of whole eye sections of control MO- and ES1-MO2-injected 4dpf larvae with mAAT antibody (red). Nuclei were stained with DAPI (blue). Immunopositive signals for mAAT were reduced only in cone ellipsoid layer (see dashed boxes and their magnified views shown in insets) of ES1- MO2-injected larvae compared to the control larvae. |
|
Morphology of cone mitochondria of MO-injected larvae. (a) Representative electron microscopic images of cone mitochondria of control MO-injected (left panels), ES1-MO1-injected (center panels) or ES1-MO2-injected (right panels) larvae at 4 dpf. Dashed lines outline each mitochondrion. (b) Images of a without dashed lines. (c) Images of Fig. 2e without dashed lines. Scale bars, 1 µm. |
|
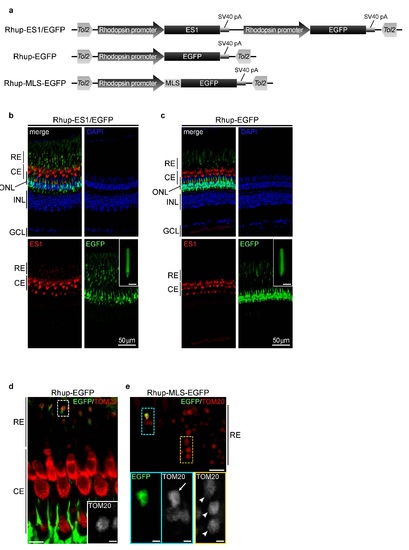
Ectopic expression of transgenes in zebrafish rods with the aid of Tol2 transposon system. (a) Schematic drawings of Tol2-based expression constructs. Coding sequences of ES1, EGFP and MLS-EGFP were driven by a sequence upstream 1,084 bp of rhodopsin gene 2. Each construct was flanked by inverted repeats of Tol2 transposon. Rhup- ES1/EGFP construct was used for the expression of ES1 and a reporter, EGFP, in rods. Rhup-EGFP and Rhup-MLS-EGFP constructs were used as controls. MLS-EGFP contains MLS of COX8 at the N-terminus 3. (b and c) Immunohistochemistries of retinal sections of TG zebrafish harboring Rhup-ES1/EGFP (b, F0 mosaic fish of the ES1-TG) or Rhup-EGFP (c, F1 non-mosaic fish of the EGFP-TG) with ES1 antibody (red). EGFP signals are represented in green. Nuclei were stained with DAPI (blue). An isolated rod outer segment and ellipsoid from each retina is shown in each inset. Scale bars, 10 µm in the insets. (d and e) Immunohistochemistries of retinal sections of EGFP-TG (d) or TG harboring Rhup-MLS-EGFP (MLS-EGFP-TG; F0 generation; mosaic, e) with TOM20 antibody (red). The inset in d and the lower panels in e are magnified views of areas surrounded by dashed lines in d and in the top panel in e, respectively. In panel e, an ellipsoid of MLS-EGFP-TG rod and ellipsoids of wild-type rods are indicated by an arrow and arrow heads, respectively. Scale bars, 10 µm in the main panel of d and the upper panel of e, and 2 µm in the inset of d and the lower panels of e. RE: rod ellipsoid, CE: cone ellipsoid, ONL: outer nuclear layer, INL: inner nuclear layar, GCL: ganglion cell layer. |
|
Purity of FACS-purified rods. Representative microscopic images of a purified rod fraction from ES1-TG. Rod cell bodies were identified by signals for both EGFP (green) and nuclei (red, stained with DAPI). Approximately 97% of nuclei-containing dots were EGFP-positive. Few dots showed signal only for either EGFP (arrow heads) or nuclei (arrows), which were derived from rod outer segment or other cells, respectively. Possible contamination of cones was also investigated by immunostaining with antibodies against cone arrestins. Population of cone arrestins-immunopositive cells was only 0.28%. |


