
Fig. 1
- ID
- ZDB-IMAGE-160407-12
- Genes
- Antibodies
- Publication
- Masuda et al., 2016 - ES1 is a mitochondrial enlarging factor contributing to form mega-mitochondria in zebrafish cones
- All Figures
- Figures for Masuda et al., 2016
|
Fig. 1
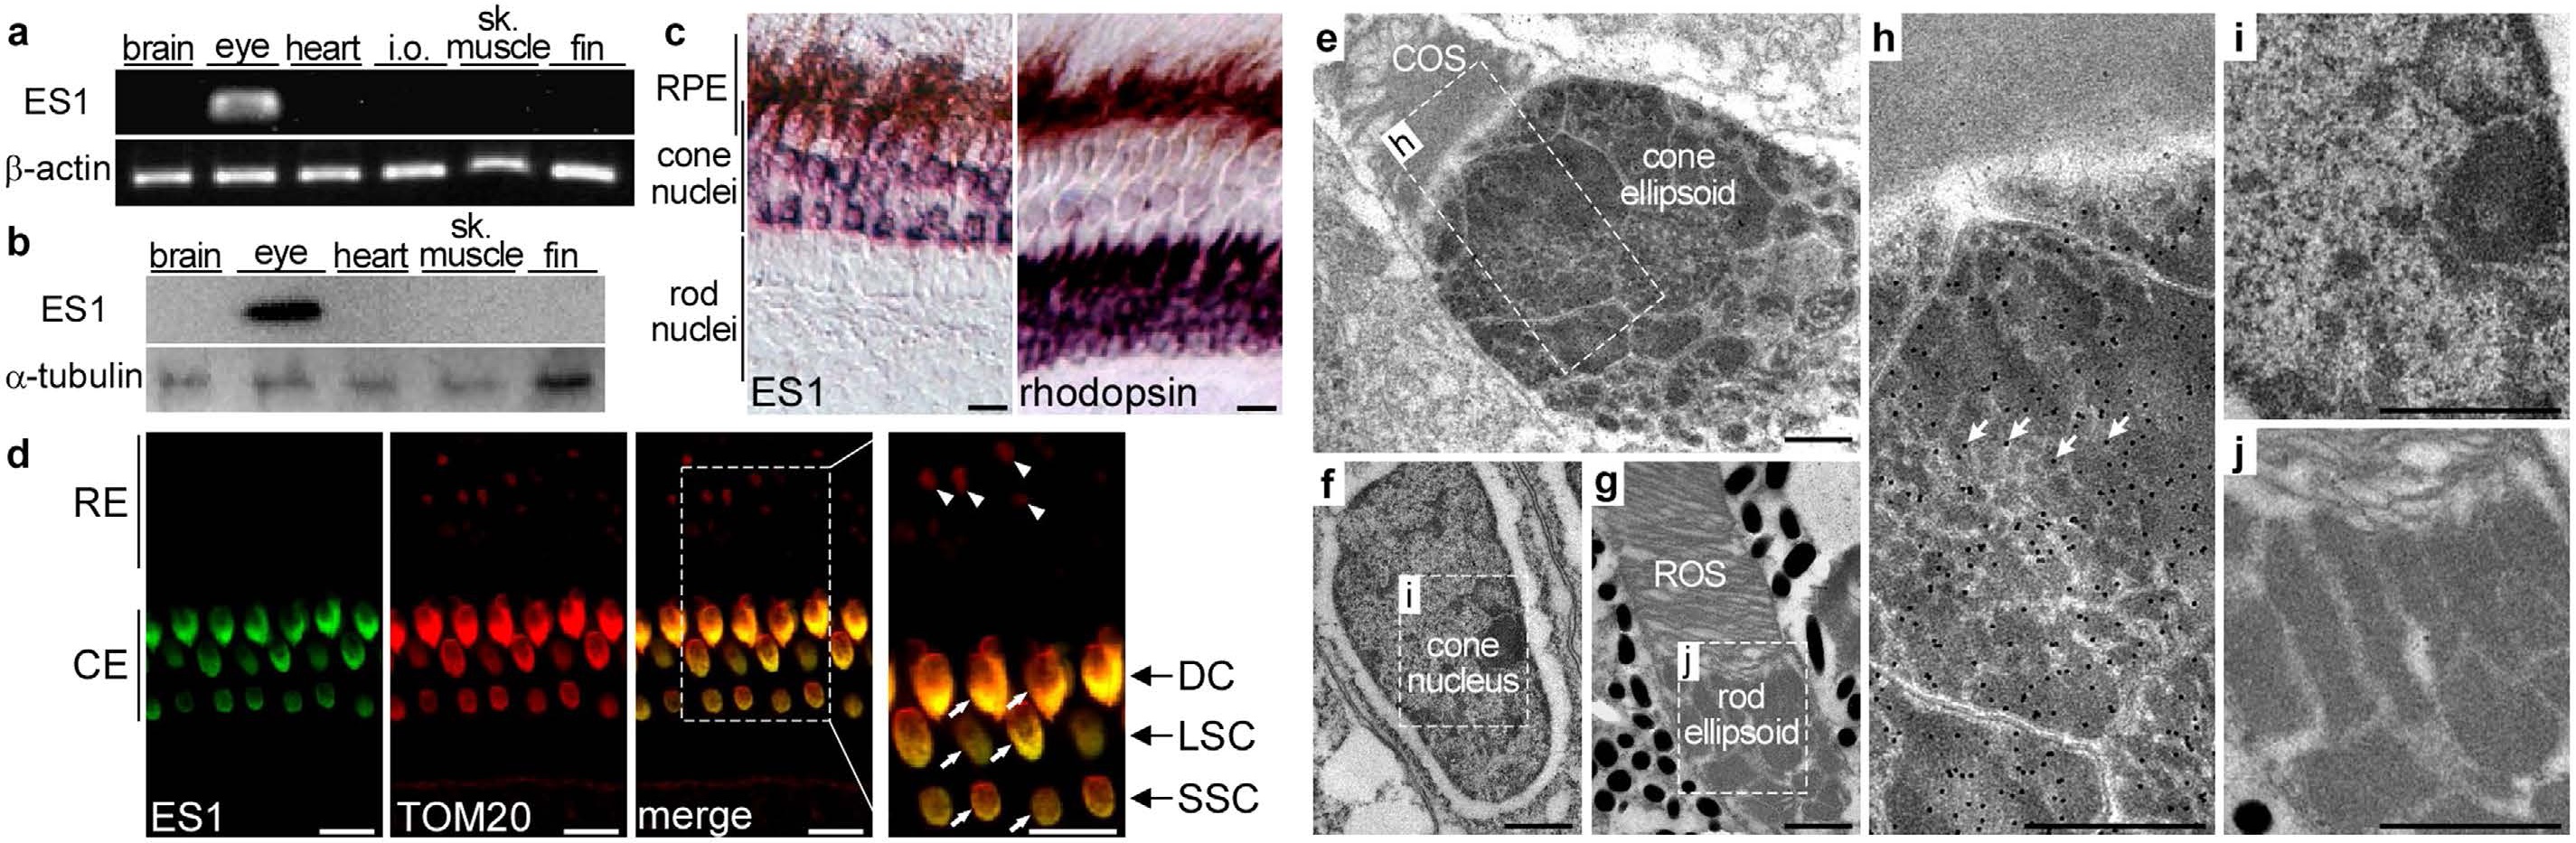
(a) RT-PCR assay for ES1 gene expression in zebrafish tissues. Beta-actin was used as an internal control for a constant amount of RNA templates. i.o. internal organs, sk. muscle: skeletal muscle. (b) Immunoblot assay with ES1 antibody in zebrafish tissues. Alpha-tubulin antibody was used as a loading control. sk. muscle: skeletal muscle. (c) In situ hybridization on adult zebrafish retina. ES1 mRNA was only detected around cone nuclei (purple staining, left panel). Rhodopsin probe was used as a rod maker (right panel). Dark-brown staining in RPE (retinal pigment epithelium) layer is due to endogenous melanin pigment. Scale bars, 10 µm. (d) Immunohistochemistry on adult zebrafish retina with ES1 (green) and TOM20 (mitochondrial marker, red) antibodies. ES1-immunoreactivity was detected in ellipsoids in all types of cones (i.e., double, long-single and short-single cones, arrows) but not in rod ellipsoids (arrow heads). Scale bars, 10 µm. RE: rod ellipsoid, CE: cone ellipsoid, DC: double cone, LSC: long-single cone, SSC: short-single cone. (e-j) Immuno-gold electron microscopy with ES1 antibody on adult zebrafish retina. Each panel shows a cone ellipsoid with an outer segment (in e), a cone nucleus (in f) or a rod ellipsoid with an outer segment (in g). Panel (h-j) are magnified views of the areas surrounded by dashed lines in (e-g), respectively. A mega-mitochondrion was observed in the apical region of the cone ellipsoid (in (e) and (h), adjacent to the outer segment). Arrows indicate gold particles in (h). Scale bars, 1 µm in (e-j). COS: cone outer segment, ROS: rod outer segment.