
- Title
-
Deiodinase knockdown affects zebrafish eye development at the level of gene expression, morphology and function
- Authors
- Houbrechts, A.M., Vergauwen, L., Bagci, E., Van Houcke, J., Heijlen, M., Kulemeka, B., Hyde, D.R., Knapen, D., Darras, V.M.
- Source
- Full text @ Mol. Cell. Endocrinol.
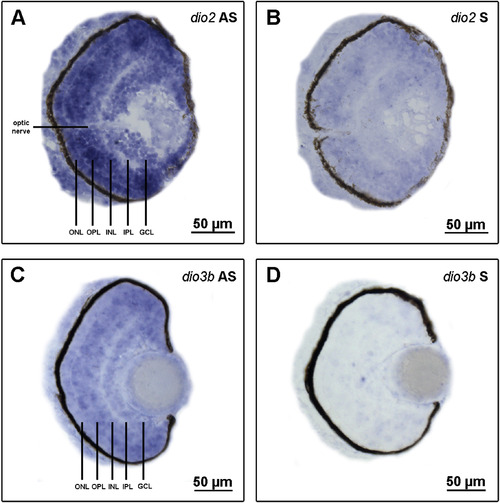
In situ hybridization of dio2 and dio3b on consecutive transverse cryosections of the eye of uninjected control zebrafish at 3 dpf. (A) dio2 AS: dio2 is expressed throughout all layers of the retina except IPL and most strongly in the OPL and ONL. (B) dio2 S: negative control. (C) dio3b AS: dio3b is also expressed in all retinal layers except IPL and most strongly in OPL and INL. (D) dio3b S: negative control. The different layers of the retina are indicated as GCL: ganglion cell layer; IPL: inner plexiform layer; INL: inner nuclear layer; OPL: outer plexiform layer; ONL: outer nuclear layer. AS: antisense probe; S: sense probe. EXPRESSION / LABELING:
|
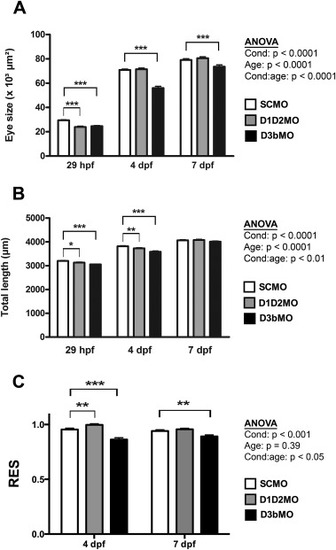
Effects of deiodinase KD on morphometric parameters. (A) Eye size at 29 hpf, 4 and 7 dpf. (B) Body length at 29 hpf, 4 and 7 dpf. (C) Calculated relative eye size (RES) values (observed eye size divided by expected eye size, see Supplementary Fig. S2) at 4 and 7 dpf. Data represent mean + SEM (n ≥ 47 per group). Statistical significance scores are based on coefficients of a mixed effects model (batch = random effect). *p<0.05, **p<0.01, ***p<0.001. SCMO: control group, D1D2MO: KD of D1+D2; D3bMO: KD of D3b |

Effects of deiodinase KD on retinal lamination. Hematoxylin and eosin stain on cross sections of the eye of control and KD animals at 3 and 7 dpf. The different layers of the retina are denoted in the control conditions. GCL: ganglion cell layer; IPL: inner plexiform layer; INL: inner nuclear layer; OPL: outer plexiform layer; ONL: outer nuclear layer. SCMO: control group, D1D2MO: KD of D1+D2; D3bMO: KD of D3b. PHENOTYPE:
|
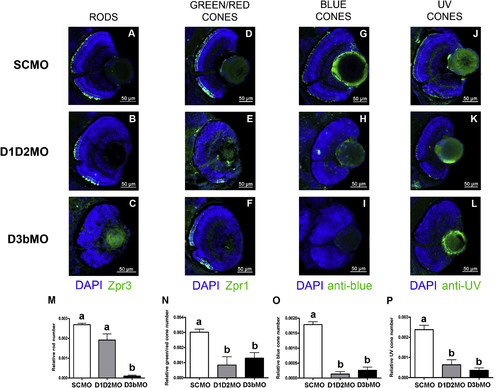
Effects of deiodinase KD on relative rod and cone photoreceptor number. (A-L) Immunohistochemical stainings with Zpr3, Zpr1, anti-blue opsin and anti-UV opsin antibodies on cryosections of the eye of control (A,D,G,J), D1D2MO (B,E,H,K) and D3bMO (C,F,I,L) larvae at 3 dpf. Zpr1 is a marker for both green and red cone photoreceptors, Zpr3 is a marker for rod photoreceptors and anti-blue and anti-UV opsin label the outer segment of blue and UV cone photoreceptors respectively. Blue: DAPI staining of the nuclei; Green: Zpr1/Zpr3+Alexa488 or anti-blue/anti-UV + FITC. (M-P) Data for relative rod/cone number (expressed per retinal surface area) are shown as mean + SEM (n ≥ 5 per group). Groups with no common letter are significantly different (p < 0.05). Data in (N,O,P) followed Gaussian distribution and were analyzed by one-way ANOVA with Tukey post hoc test. Data in (M) did not assume Gaussian distribution and were analyzed by Kruskal-Wallis and Dunn′s post hoc test. SCMO: control group, D1D2MO: KD of D1+D2; D3bMO: KD of D3b. EXPRESSION / LABELING:
PHENOTYPE:
|
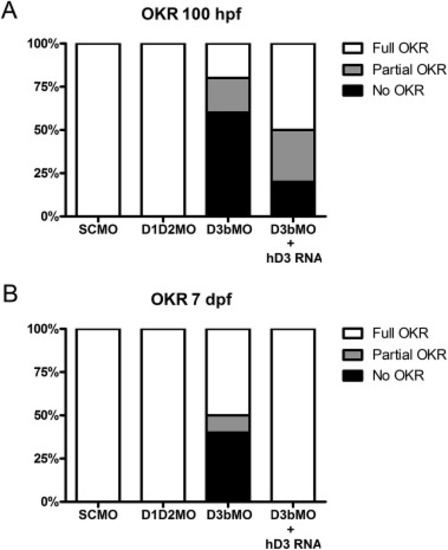
Optokinetic response test to reveal visual impairments. Semi-quantitative scoring of the optokinetic response (OKR) test at 100 hpf and 7 dpf for control, KD and rescue larvae. Data show a significant delay for D3bMO when compared to control and D1D2MO larvae at 100 hpf and compared to all groups at 7 dpf (p < 0.001 and p < 0.05 respectively, Chi-square statistics). Co-injection with hD3 mRNA partially rescues the phenotype. SCMO: control group, D1D2MO: KD of D1+D2; D3bMO: KD of D3b, D3bMO + hD3 RNA: rescue group; Full OKR: normal optokinetic response with the eyes following the movement of the stripes and returning to their original position; Partial OKR: the eyes follow the movement of the stripes but do not return to their original position after reaching the border of the visual field; no OKR: fish do not respond to the moving stripes. |
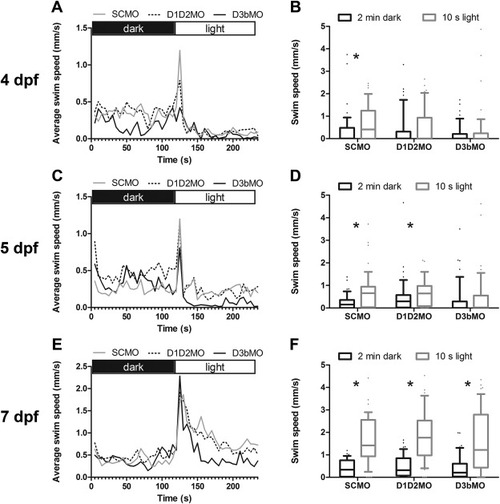
Analysis of the light response in control and deiodinase KD larvae. The light response was analyzed at 4 dpf (A,B), 5 dpf (C,D) and 7 dpf (E,F). The left column depicts average activity patterns for the different conditions throughout the test period. The right column specifically compares activity in the last 2 min in the dark with activity during the first 10 s of light. Boxes show median with 25th and 75th percentiles. Whiskers represent 10th and 90th percentiles. Statistical comparisons were made using wilcoxon-matched pairs signed rank test. *: significant difference between activity in dark and light, i.e. significant light response (p<0.05). SCMO: control group, D1D2MO: KD of D1+D2; D3bMO: KD of D3b. |
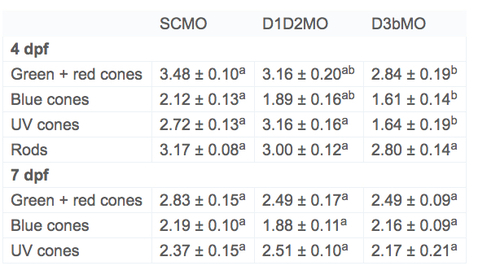
Relative rod and cone photoreceptor number in D1D2MO and D3bMO zebrafish at 4 and 7 dpf. Data represent relative cone/rod numbers per retinal surface area (expressed as number ×10-3/pixel2) and are shown as mean ± SEM (n ≥ 5 per group). The following antibodies were used: Zpr1 (green and red cones), anti-blue opsin (blue cones), anti-UV opsin (UV cones) and Zpr3 (rods). Rod data were obtained in a separate experiment and only counted at 4 dpf. For a given opsin and stage groups with no common letter are significantly different (p < 0.05). Data followed Gaussian distribution and were analyzed by one-way ANOVA with Tukey post hoc test. PHENOTYPE:
|
Reprinted from Molecular and Cellular Endocrinology, 424, Houbrechts, A.M., Vergauwen, L., Bagci, E., Van Houcke, J., Heijlen, M., Kulemeka, B., Hyde, D.R., Knapen, D., Darras, V.M., Deiodinase knockdown affects zebrafish eye development at the level of gene expression, morphology and function, 81-93, Copyright (2016) with permission from Elsevier. Full text @ Mol. Cell. Endocrinol.