
- Title
-
Zebrafish TARP Cacng2 is required for the expression and normal development of AMPA receptors at excitatory synapses
- Authors
- Roy, B., Ahmed, K.T., Cunningham, M.E., Ferdous, J., Mukherjee, R., Zeng, W., Chen, X.Z., Ali, D.W.
- Source
- Full text @ Dev. Neurobiol.
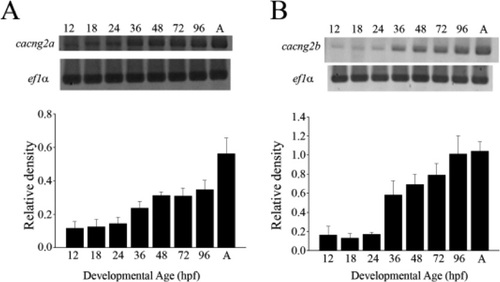
Expression of cacng2a and cacng2b in embryonic zebrafish. Expression of TARP genes cacng2a (A) and cacng2b (B) was assayed using RTPCR on RNA harvested from whole zebrafish embryos (1296 hpf) and adult (>1 year) brain (n = 3 in each groups). Band densities were calculated using ImageJ. Data are expressed as a ratio of density of TARPs to the density of ef1α housekeeping gene ± SEM for a given developmental age. EXPRESSION / LABELING:
|
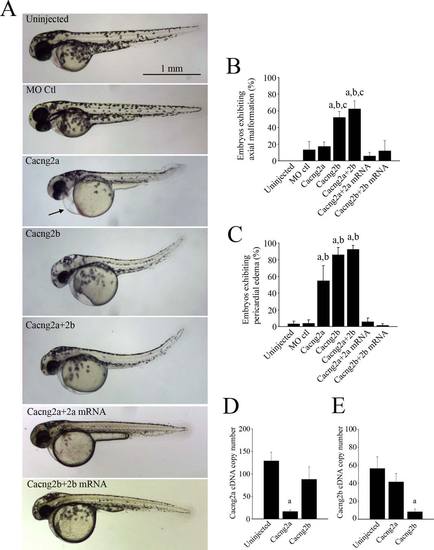
Zebrafish embryos injected with morpholino oligonucleotides show morphological changes compared with uninjected embryos, embryos injected with a standard control morpholino oligonucleotide and morphant embryos co-injected with Cacng2 mRNA (A). (B) Bar graph showing the percentage of embryos exhibiting axial malformations such as curved tails or malformed trunks. (C) Bar graphs showing the percentage of embryos exhibiting pericardial edema [shown by an arrow in (A)]. (D) Bar graphs show the cacng2a cDNA copy number in uninjected (n = 9), cacng2a (n = 10) and cacng2b (n = 9) morphants. (E) Bar graphs show the cDNA copy number of cacng2b in uninjected (n = 9), cacng2a (n = 10) and cacng2b (n = 8) morphants. aSignificantly different from uninjected controls (p < 0.05). bSignificantly different from morpholino controls (p < 0.05). cSignificantly different from Cacng2a morphants (p < 0.05). PHENOTYPE:
|
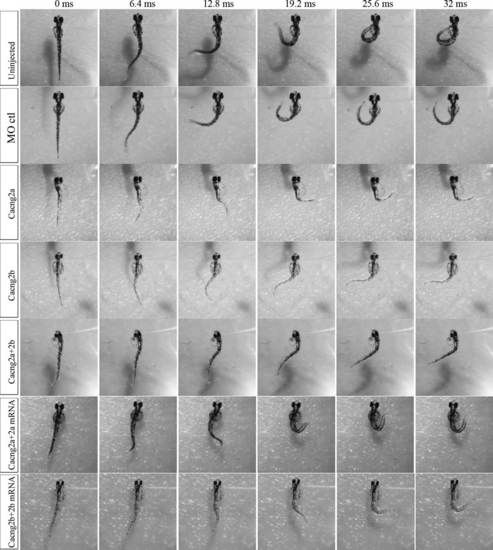
Examples of touch responses of 48–52 hpf agar-restrained embryos. Images were captured every 800 µsec but every 8th image is shown over the first 32 ms of the response. At the 32-ms time point, the uninjected and MO-injected control embryos have undergone an entire C-bend and the trunk is starting to move back. The Cacng2a and Cacng2b morphants have reached the full C-bend by 32 ms, while the Cacng2a+2b morphant has still not completed its bend. The morphants are slightly misshapen, exhibit edema and are generally smaller than the controls. Morphants injected with Cacng2a mRNA showed similar locomotor responses to controls while those injected with Cacng2b mRNA were similar to the Cacng2b morphants. PHENOTYPE:
|
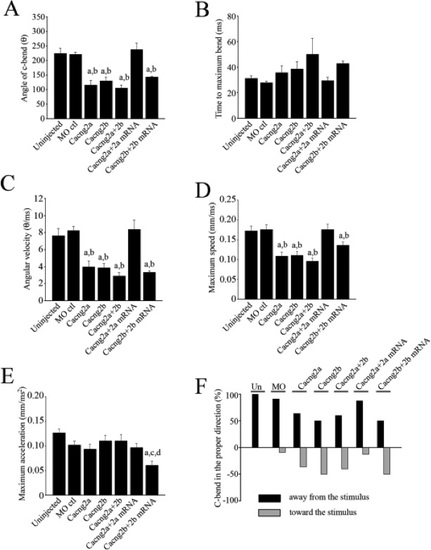
Quantification of the locomotor responses. (A) Angle of the C-bend ascertained by measuring the degree of rotation of the tail from the unstimulated, start position. (B) Time of the C-bend from the moment the fish starts to respond to the stimulus to the maximum point of curvature of the tail. (C) Angular velocity of the tip of the tail calculated by dividing the maximum bend angle by the time of the response. (D) Maximum speed, (E) Acceleration, (F) Direction of the C-bend. An appropriate response occurs when embryos bend away from the stimulus. a Significantly different from uninjected controls (p < 0.05). b Significantly different from morpholino control (p < 0.05). c significantly different from Cacng2a+2b. d significantly different from Cacng2b morphants (p < 0.05). PHENOTYPE:
|
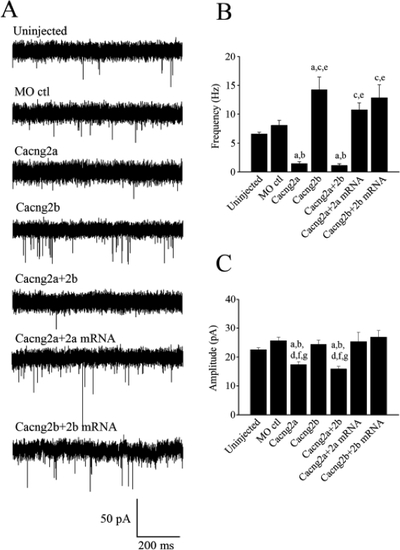
Spontaneous synaptic AMPAR currents obtained from Mcells. (A) Uninjected embryos (n=6), control MO (4 ng) injected embryos (n=5), Cacng2a MO (4 ng), Cacng2b MO (4 ng) and Cacng2a+2b MO (2 ng+2 ng) injected embryos (n=5), Cacng2a MO (4 ng)+250 pg Cacng2a mRNA (n=5) and Cacng2b MO (4 ng)+250 pg Cacng2b mRNA injected embryos (n=3) exhibit AMPAR currents. The inclusion of NBQX (0.1 μM) confirmed the mEPSCs as AMPAR-mediated (data not shown). Preparations were incubated in TTX (1 μM), strychnine (5 μM), picrotoxin (100 μM) and APV (50 μM) to block action potentials, glycine, GABA and NMDA receptors respectively. (B) Bar graph comparing the mean frequency of mEPSCs. (C) Bar graph comparing the mean mEPSC amplitudes of events obtained from each of the 5 different groups. aSignificantly different from uninjected controls (p < 0.01). bSignificantly different from morpholino controls (p < 0.05). cSignificantly different from Cacng2a (p<0.05). dSignificantly different from Cacng2b (p<0.05). eSignificantly different from Cacng2a+2b morphants (p<0.001). fSignificantly different from Cacng2a+2a mRNA (p<0.001). gSignificantly different from Cacng2b+2b mRNA (p<0.001). PHENOTYPE:
|
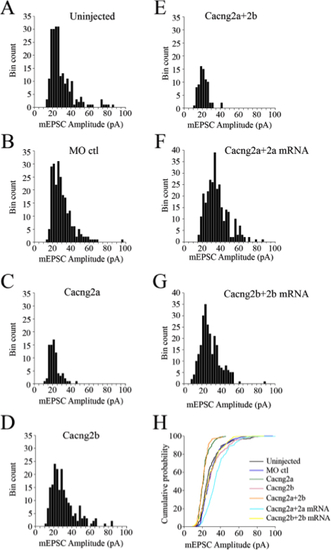
Amplitude distributions of mEPSCs obtained from control and morphant embryos. Example of amplitude distributions of mEPSCs recorded from (A) an uninjected embryo (n=219 events, bin width=2.5 pA). (B) A MO control injected embryo (n=234 events, bin width =2.5 pA). (C) A Cacng2a MO injected embryo (n = 78 events, bin width =2.5 pA). (D) A Cacng2b MO injected embryo (n =202 events, bin width=2.5 pA). (E) A Cacng2a+2b MO injected embryo (n=76 events, bin width=2.5 pA). (F) A Cacng2a MO +Cacng2a mRNA injected embryo (n = 164 events, bin width=2.5 pA). (G) A Cacng2b MO+Cacng2b mRNA injected embryo (n=132 events, bin width = 2.5 pA). (H) Cumulative histogram of the peak amplitude of AMPA mEPSCs from A to E. Note that the cumulative histograms from Cacng2a and Cacng2a+2b morphants are noticeably different from the uninjected controls, MO controls and Cacng2b MO recordings, which group together. |
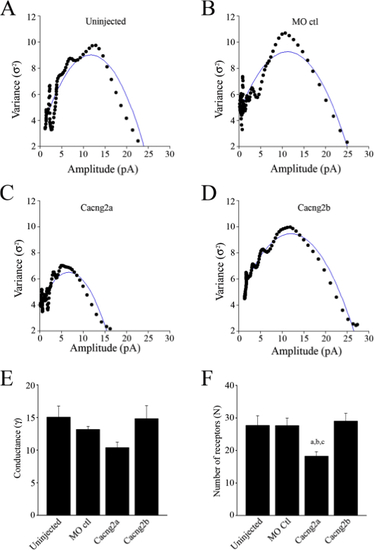
Estimates of synaptic conductance and the number of available AMPARs underlying mEPSCs. Plots of variance versus mean current amplitude of mEPSCs obtained from control uninjected embryos (A), control morpholino injected embryos (B), Cacng2a morphants (C), Cacng2b morphants (D). The blue lines indicate the fit of polynomial curves to the data. It gives an estimate of the elementary current (i) generated by the activation of 1 receptor. The conductance (γ) was calculated from the equation: γ= i/VH (VH= -60 mV). In the experiments shown, γ= 17.8 pS and N= 22 receptors in uninjected embryos, γ= 13.2 pS and N= 29 receptors in MO controls, γ= 19.2 pS and N= 12 receptors in Cacng2a morphants and γ= 13.8 pS and N=29 receptors in Cacng2b morphants. (E) Bar graph of the mean single channel conductance of AMPARs. (F) Bar graph of the mean number of available AMPARs (N) at synaptic sites. aSignificantly different from uninjected controls (p<0.05). bSignificantly different from morpholino controls (p <0.05). cSignificantly different from Cacng2b (p<0.01). PHENOTYPE:
|
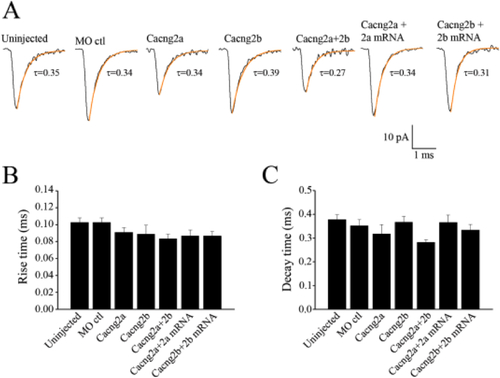
AMPA mEPSC kinetics. (A) Averaged mEPSCs fit with a single exponent over the decay phase (highlighted by the orange fit). For the uninjected control, 180 events were averaged, for the MO control 248 events were averaged, for the Cacng2a morphants 158 events were averaged, for the Cacng2b morphants 129 events were averaged, for the Cacng2a+2b morphants, 76 events were averaged, for the Cacng2a MO + Cacng2a mRNA injected embryos, 164 events were averaged and for the Cacng2b MO + Cacng2b mRNA injected embryos, 132 events were averaged. Bar graphs comparing the 20–80% Rise times of the mEPSCs (B), and the decay time constants of the mEPSCs (C). PHENOTYPE:
|
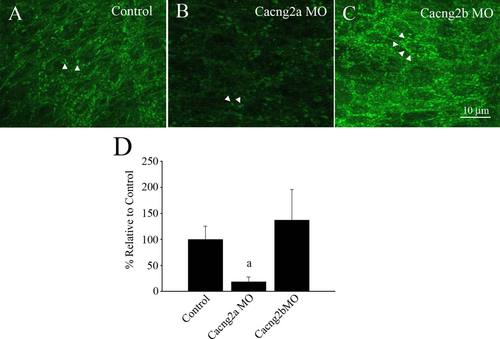
Immunohistochemical images of the zebrafish hindbrain labeled with anti-GluA2/3, from controls and splice-blocking morphants. (A) Control embryos, (B) Cacng2a morphants and (C) Cacng2b morphants. Arrowheads point to clusters of AMPA receptors (puncta). (D) Quantification of the number of puncta as a percentage of controls. aSignificantly different from controls, p < 0.05. |