
Image
|
Figure Caption
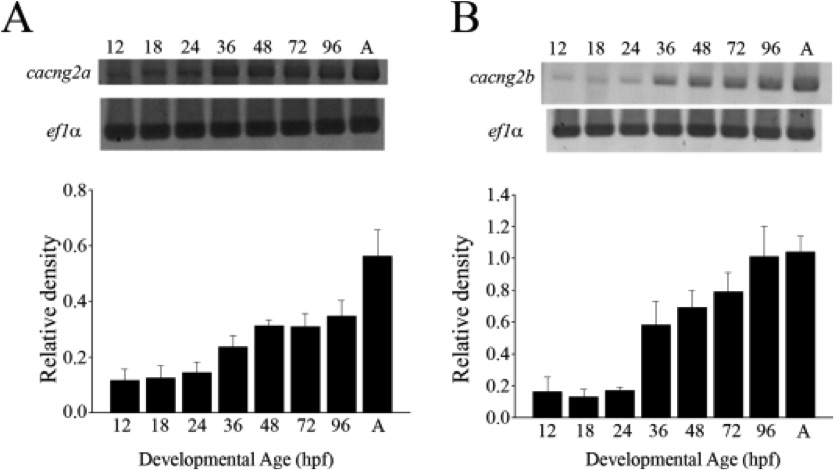
Fig. 2 Expression of cacng2a and cacng2b in embryonic zebrafish. Expression of TARP genes cacng2a (A) and cacng2b (B) was assayed using RTPCR on RNA harvested from whole zebrafish embryos (1296 hpf) and adult (>1 year) brain (n = 3 in each groups). Band densities were calculated using ImageJ. Data are expressed as a ratio of density of TARPs to the density of ef1α housekeeping gene ± SEM for a given developmental age.
Figure Data
Acknowledgments
This image is the copyrighted work of the attributed author or publisher, and
ZFIN has permission only to display this image to its users.
Additional permissions should be obtained from the applicable author or publisher of the image.
Full text @ Dev. Neurobiol.