
|
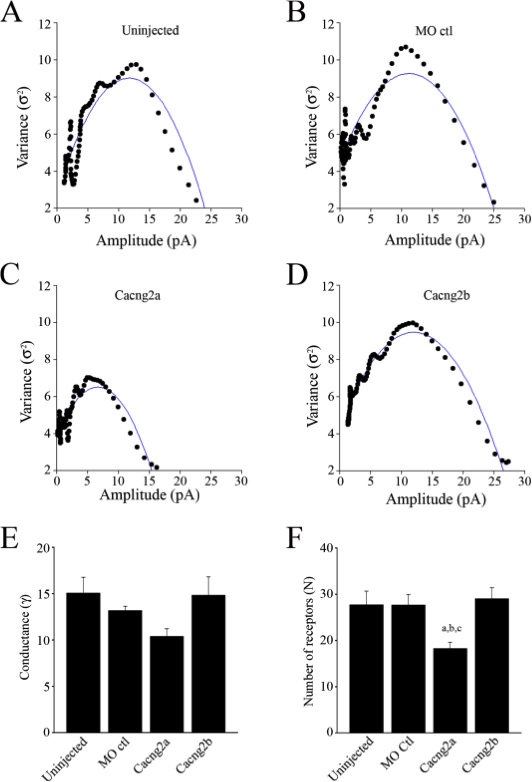
Fig. 8 Estimates of synaptic conductance and the number of available AMPARs underlying mEPSCs. Plots of variance versus mean current amplitude of mEPSCs obtained from control uninjected embryos (A), control morpholino injected embryos (B), Cacng2a morphants (C), Cacng2b morphants (D). The blue lines indicate the fit of polynomial curves to the data. It gives an estimate of the elementary current (i) generated by the activation of 1 receptor. The conductance (γ) was calculated from the equation: γ= i/VH (VH= -60 mV). In the experiments shown, γ= 17.8 pS and N= 22 receptors in uninjected embryos, γ= 13.2 pS and N= 29 receptors in MO controls, γ= 19.2 pS and N= 12 receptors in Cacng2a morphants and γ= 13.8 pS and N=29 receptors in Cacng2b morphants. (E) Bar graph of the mean single channel conductance of AMPARs. (F) Bar graph of the mean number of available AMPARs (N) at synaptic sites. aSignificantly different from uninjected controls (p<0.05). bSignificantly different from morpholino controls (p <0.05). cSignificantly different from Cacng2b (p<0.01).