
|
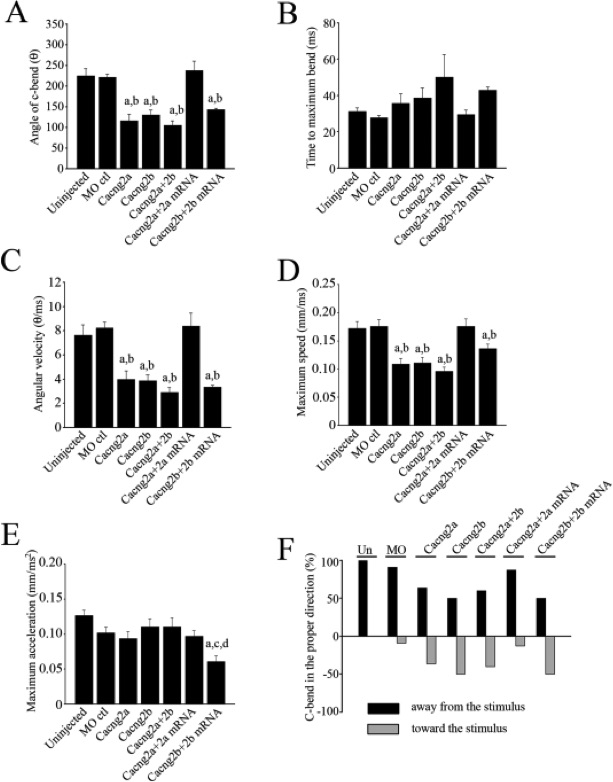
Fig. 5 Quantification of the locomotor responses. (A) Angle of the C-bend ascertained by measuring the degree of rotation of the tail from the unstimulated, start position. (B) Time of the C-bend from the moment the fish starts to respond to the stimulus to the maximum point of curvature of the tail. (C) Angular velocity of the tip of the tail calculated by dividing the maximum bend angle by the time of the response. (D) Maximum speed, (E) Acceleration, (F) Direction of the C-bend. An appropriate response occurs when embryos bend away from the stimulus. a Significantly different from uninjected controls (p < 0.05). b Significantly different from morpholino control (p < 0.05). c significantly different from Cacng2a+2b. d significantly different from Cacng2b morphants (p < 0.05).